Full Report
What a Korean real estate trust company actually sells
A Korean 부동산신탁회사 (real estate trust company) sells a legal container. Under the Trust Act, a settlor transfers legal title in a property to a trustee, which then manages, develops, or disposes of that property for the benefit of a named beneficiary and takes a fee for doing so [1]. Nothing about that is unique to Korea. What makes it an industry is that the trustee must hold a licence: real estate trust is a category of financial investment business under the Financial Investment Services and Capital Markets Act, licensed and supervised by the Financial Services Commission under a single licence unit, 4-121-1, covering movables, real property, and real-property-related rights [2].
The economic organising principle follows from the transfer of title. Once the land sits in the trust, the Trust Act separates it from the bankruptcy estate of both the settlor and the trustee, and Article 22 bars compulsory execution against it [3]. That gives the structure four functions the filings name explicitly: custody of development cash so pre-sale proceeds cannot be diverted, bankruptcy remoteness for the land and building, dispute mediation among the parties to a development, and conversion of the property into divisible, tranched beneficiary certificates [4].
So the customer buying a trust is rarely buying property management. A developer buys credibility with a lender; a lender buys a controlled disbursement account and an enforceable security route; an apartment buyer paying instalments years before completion buys protection against the developer failing. The trust company is paid by the developer or landowner, usually out of pre-sale receipts, but the party whose comfort actually closes the deal is the project-finance lender.
Price is a function of how much risk the trustee absorbs
The industry publishes its price list. Korea Asset In Trust's base fee schedule shows the whole logic of the business in one table: the same building, the same trustee, and a fee that moves by seven times depending on who is on the hook for the construction money.
Source: FY2025 Annual Report, II. 사업의 내용 — 기본보수 산정 기준 및 요율 [5]. Rates are the published base schedule; actual contracts are negotiated.
The filings describe the two ends of that ladder in the same terms. A loan-type land trust is the arrangement in which the trust company directly raises the construction cost, carrying funding risk in exchange for a larger fee; a management-type trust leaves funding with the settlor or contractor, so the trustee has no advance at risk and earns correspondingly less [6]. The competing listed trust, KOREIT, words it the same way and adds the consequence: in loan-type work the trustee bears loss risk on money advanced in its own name [7].
The collateral trust sits at the other end and earns 0.2%, because it competes against an alternative that costs nothing to the trust industry — a conventional mortgage. The filings set out why lenders pay anyway: a collateral trust needs no pre-attachment to exercise subrogation, is not caught by the debtor's rehabilitation proceedings, is realised by the trust company's own public tender rather than court auction, and blocks the priority that wage claims would otherwise take [8].
Where the assets sit and where the money is made
Two different scales are quoted for this industry and they measure different things. Assets under trust (수탁고) is trust principal accepted; operating revenue is fees plus interest. The filings warn that the correlation between the two is low, because each trust type prices off a different base [9].
All real estate trust AUM (₩tn)
At the 14 licensed trusts (₩tn)
Industry operating revenue (₩bn)
Licensed trust companies
Industry headcount
Scope: Korean real estate trust business only, as at 31 December 2025, sourced by both listed trusts from the Korea Financial Investment Association. Assets under trust ₩560tn in total, of which ₩457tn at the dedicated trust companies [10] [11]; operating revenue, licensed-company count and headcount [12] [13].
Banks, securities firms, and insurers may also act as real estate trustees, but only for the passive products. Of the ₩560tn of real estate trust assets outstanding at the end of 2025, banks held ₩89.9tn, securities firms ₩7.9tn, and insurers ₩4.6tn — and none of them held a single won of land trust or pre-sale management trust, both of which sit entirely with the 14 dedicated companies [14]. Development work is the licensed specialists' preserve; the banks compete only where the trust is a security wrapper.
Within the specialists, the split between where assets sit and where fees are earned is stark.
Source: derived from the FY2025 Annual Report tables of assets under trust by type [15] and industry trust fees by type [16]. Fee yield is the ratio of the two; the filings caution that trust principal is not the fee base for every product.
Land trust is 23% of the assets and 80% of the fee pool. Collateral trust is 74% of the assets and 19% of the fees. That ratio is the industry's central fact: the passive, growing, low-risk book generates roughly 3 basis points of fee on assets, while the development book generates roughly 44. Every strategic argument inside these companies is about how far up that gradient to climb.
The profit pool along the development chain
Source: assembled from the product and fee descriptions in the FY2025 Annual Report [17] [18] [19], and the HUG-guaranteed redevelopment disclosure in the contingent-liability note [20].
Two features of that chain matter more than the rest. First, the trust company's fee is charged on pre-sale proceeds, so revenue is recognised over the life of a project — the filings put the conversion of a signed mandate into revenue at three to four years [21]. Orders won in a boom therefore land as revenue into a downturn, and orders lost in a downturn hollow out revenue years later. Second, in redevelopment and completion-guarantee work the trustee stands behind other parties' performance, which converts a fee business into a contingent credit business. That is the industry's principal structural conflict, and the last four years are a live test of it.
The arena: fourteen licensed companies, and what they earn
Fourteen companies hold the licence. Four date from the 1990s, seven from the 2000s, and three were licensed in 2019 — 대신자산신탁 in July and 신영부동산신탁 and 한국투자부동산신탁 in October [22]. None of them is a REIT; all are supervised financial institutions.
Sources: operating revenue, fee income, staff and fee per head for FY2025, Korea Asset In Trust FY2025 Annual Report [23] [24]; equity and net income on a separate-financial-statement basis at 31 December 2025, KOREIT FY2025 Annual Report [25]. Share is derived from operating revenue.
Five of the fourteen lost money in 2025, and the losses are not small relative to the capital behind them: Woori Asset Trust lost ₩220.6bn against ₩239.4bn of equity, Kyobo ₩149.6bn against ₩358.9bn, and Mugunghwa ₩93.3bn against ₩25.1bn of remaining equity [26]. Capital, not revenue, is what separates the companies now — and the two largest capital bases, KOREIT at ₩892.9bn and Korea Asset In Trust at ₩867.2bn, belong to firms with mid-table fee income.
Fee productivity per head across the fourteen licensees is compared in Competition.
The 2019 licences reshaped the share table
Source: derived from the industry market-share tables for 2017-2021 [27] and 2021-2025 [28]. Top-4 is the four largest companies by operating revenue in each year; entrants are Daishin, Shinyoung, and Korea Investment, all licensed in 2019.
In 2017 the four largest companies took 60.5% of industry revenue, and Korea Asset In Trust, then second by revenue behind KOREIT, took 20% on its own [29]. By 2025 the top four took 43.5% and the three companies licensed in 2019 took 10.8% between them [30]. Two effects are tangled here and the filings do not separate them: new licences added supply into a market that stopped growing, and the ranking also churned for reasons of ownership — Asia Trust, sixth by revenue in 2021, appears in the 2025 table as Shinhan Asset Trust and leads it. The record of who took share from whom belongs to Competition; what the arena shows is that a licensing decision made in 2019 is still redistributing revenue in 2025.
The industry's revenue changed character, not size
Sources: 2017-2021 from the FY2021 Annual Report industry table [31]; 2021-2025 from the FY2025 Annual Report industry table [32]. Both are compiled from Korea Financial Investment Association filings on a separate-financial-statement basis.
Industry operating revenue in 2025, at ₩1,664.1bn, was 3.7% higher than in 2021 and 4.0% below the 2022 peak [33]. On the top line, nothing much happened. Underneath, the composition inverted. Trust fees fell 43% from ₩1,039.5bn in 2022 to ₩589.6bn in 2025, and land-trust fees specifically fell from ₩894.4bn to ₩468.6bn. Over the same three years, interest on loans to trust accounts rose from ₩103.4bn to ₩388.9bn — 3.8 times [34].
That second line is not a new product. Interest on trust-account loans accrues when the trust company advances its own money into a project that cannot fund itself — either because the structure always required it, as in loan-type land trust, or because something went wrong. Revenue of that kind grows fastest when projects stall. Industry-wide, roughly ₩1 in ₩4 of 2025 operating revenue was interest on the industry's own advances into the schemes it manages, against ₩1 in ₩16 in 2022.
A caveat on these tables. Both listed trusts publish the same Korea Financial Investment Association series, and their versions disagree in places: 2024 trust fees are ₩784.8bn in the Korea Asset In Trust filings and ₩764.8bn in KOREIT's, and the itemised fee lines do not always sum to the fee-income total shown above them [35] [36]. The series is self-reported and revised; differences of one or two percent between filings should not be read as signal.
The structural conflict: a fee business that guarantees other people's performance
Three of the industry's products put the trustee behind a third party. In loan-type land trust the trust company funds the build. In completion-guarantee management trust, it promises to finish the building if the contractor fails and to compensate the lenders if it cannot. In HUG-guaranteed redevelopment trust, the standard agreement makes the trust company, as project implementer, the party carrying the completion obligation [37].
Korea Asset In Trust named the risk in its FY2022 filing, writing that as the risk of project-finance distress widened, the risk factors in completion-guarantee products came into focus, because a contractor falling behind schedule or a long unsold period increases the trust company's exposure [38]. The size of that exposure, and its subsequent unwind, is disclosed year by year.
Sources: FY2022 and FY2023 columns from the FY2023 Annual Report contingent-liability note [39]; FY2024 from the FY2024 note [40]; FY2025 from the FY2025 note [41]. Completion-guarantee sites are the 책임준공토지신탁 line; the total adds HUG-guaranteed and other redevelopment trust obligations.
At the end of 2022 one company stood behind ₩1,126.5bn of drawn lender debt across 25 projects, of which 18 were completion-guarantee sites carrying ₩600.5bn [42]. By the end of 2025 the same disclosure covered five projects and ₩126.3bn [43]. The intervening year shows what the obligation means in practice: at the end of 2024 one of the seven remaining sites had passed its contractor's completion deadline, with ₩80.3bn of loans outstanding against it, and the trust company had applied for temporary occupancy approval on part of the building to meet its own deadline [44].
The obligation is disclosed but not provisioned. The filings state each year that the loss cannot be reliably measured and so no amount is recognised, with the exposure monitored project by project instead [45]. Where a completion promise is actually performed, the money appears elsewhere — as advances (대지급금) inside the loan book.
Where the exposure lands on the balance sheet
The visible cost of the cycle shows up in loans to trust accounts. At the end of 2025 Korea Asset In Trust carried ₩802.6bn of gross trust-account loans against ₩161.2bn of allowance — 20.1% — up from ₩819.1bn against ₩107.8bn, or 13.2%, a year earlier [46]. These claims are not unsecured lending in the ordinary sense: the filings note that trust-account loans and advances are recoverable from the trust estate under the Trust Act's expense-reimbursement right [47]. Recovery therefore depends on the project selling, which is the same variable that determines the fee.
Source: FY2025 Annual Report, 재무건전성 — 자산건전성현황 and 고정이하자산비율 [48]. Classification is of consolidated assets subject to soundness classification, and the filings note that the soundness of trust-account lending is reviewed quarterly using receivable amount, sales rate, and construction progress [49].
Two constraints bound how far this can run. Regulation 3-26 of the Financial Investment Business Regulation requires a type-3 financial investment business to hold a net operating capital ratio of at least 150%, and Regulation 3-41 requires a real estate trust company to hold a won liquidity ratio of at least 100% [50] [51]. Korea Asset In Trust reported 363% at end-2025, having dipped to 284% at end-2024 [52]; KOREIT reported 230.1%, down from 306.3% two years earlier [53]. The prudential ratio is what converts a bad property cycle into a binding limit on how much new development work a trust company may write.
Where the industry sits in its cycle
The filings' own framing is that real estate trust follows the property cycle, but not simply. Recessions reduce the volume of development while raising the demand for the safety features the trust structure provides — so the industry describes itself as exposed to both quantitative and qualitative swings in property activity [54]. That claim has held up in an uncomfortable way: assets under trust at the dedicated companies rose every year from ₩342.4tn in 2021 to ₩457.5tn in 2025 while trust fees fell 43% from the 2022 peak [55] [56]. Volume grew; price and mix collapsed.
The outlook language in the filings moved in three steps. In FY2021 the development market was described in terms of domestic policy to cool an overheating property market and externally rising protectionism [57], and continued demand for loan-type land trust was expected regardless of property-market volatility [58]. In FY2024 it was a global rate-tightening cycle contracting the market [59]. In FY2025 it is project-finance distress and macro uncertainty together [60], with loan-type land trust described as affected by weakened investment sentiment [61].
The transmission mechanism is set out plainly in the same filing's divisional review: through 2025 the trust industry faced slowing property activity, a contracting project-finance market, and rising construction costs; development starts fell and pre-sales at some sites were delayed, which cut trust and management fees while the deteriorating soundness of trust-account assets pushed provisions up [62]. The forward risk named there is specific — the workout and recovery of provincial loan-type land trust projects may run slow, with government-led court and public auctions gradually restructuring distressed sites while non-capital-region and non-residential uncertainty persists [63].
This is not the industry's first shakeout. The two trust companies that ran Korea's land-trust market in the 1990s — Daehan Real Estate Trust (대한부동산신탁), later renamed Koret Trust, and Korea Real Estate Trust (한국부동산신탁) — were both wound up, and Korea Asset In Trust was built in 2001 out of the assets, staff, and systems it acquired from them [64]. The mechanism that killed them was the same one visible in the loss column today: a development trust that funds construction is a lender to a property market, and in a bad enough market a lender to a property market can lose its capital. What differs this time is that the losses are concentrated in the smaller and newer licensees rather than the largest.
Three currents to carry into the other tabs
The fee pool is migrating from greenfield development to redevelopment
Both listed trusts are writing more of their new work in 정비사업 — reconstruction and redevelopment of existing estates, opened to trust companies by the 2016 amendment to the urban-maintenance law, under which the trust company acts as the scheme's operator or agent in place of the owners' association [65].
At Korea Asset In Trust the shift is a four-year trend: redevelopment land-trust fees contracted rose from ₩4bn in 2022 to ₩43bn in 2025 while conventional loan-type mandates fell from ₩38bn to ₩16bn (History).
KOREIT's disclosed order mix moves in the same direction but far more erratically, which is itself a feature of the industry: individual mandates are large enough that a single year's mix says little.
KOREIT's own order mix by product is recorded in Competition.
The economics of the switch are set out in the fee card: redevelopment trust prices at 2.5% of pre-sale proceeds against 0.5% for plain management-type work, and the trustee carries operator obligations rather than funding risk [66]. Redevelopment schemes also run on long approval clocks, so the fees contracted in 2024 and 2025 sit several years from recognition.
Revenue is becoming more interest-like and less fee-like
The industry earned ₩388.9bn of interest on its own advances into trust accounts in 2025, against ₩589.6bn of trust fees [67]. At Korea Asset In Trust specifically, trust-account interest was ₩51.5bn in 2025 against ₩41.4bn of land-trust fees — the interest line is now the larger of the two [68]. Two readings of the same number are available and the evidence does not yet separate them: interest that accrues on a performing loan-type project is contracted return on capital deployed, while interest accruing on a stalled project is an accounting entry whose cash realisation depends on eventual sales. The 20.1% allowance now carried against the trust-account loan book is the company's own estimate of how much of that balance will not come back [69].
The property recovery is regional, and the trust book is not
Management's own account of 2025 draws the line explicitly: the capital region recovered gradually while the non-capital regions where its main project sites are concentrated kept a high share of unsold housing, deepening a regional split that delayed sales and impaired project viability [70]. For 2026 the same filing expects a full market recovery to stay limited, citing rate volatility, possible changes in government housing policy, and rising construction costs, while stating that provisioning taken across 2024 and 2025 should ease further credit costs [71]. The stated strategic response — diversify regions and products, tighten underwriting on loan-type land trust and other high-risk categories, and push into redevelopment and non-land trust — reads as the same response the whole industry is attempting [72].
What the evidence here cannot settle
Three limitations are worth carrying forward rather than glossing.
There is no independent market-size series. Every figure above traces to the Korea Financial Investment Association's member filings, republished by the trust companies themselves, and the two listed trusts publish versions that differ in detail [73] [74]. There is no third-party market study in the record.
Only one listed pure-play comparable exists. That peer set is adjudicated comparator by comparator in Competition. Peer economics in this tab therefore come from the two Korean trusts' own filings, which disclose all fourteen licensees, rather than from the listed peer set.
Product-level profitability is not disclosed anywhere. Korea Asset In Trust's management discussion splits operating profit between its trust division and its capital-finance subsidiary [75], and KOREIT declares three divisions but reports only one because trust exceeds 90% of revenue [76]. Neither breaks profit out by trust product, so the margin on land trust against collateral trust against REIT management cannot be observed — only revenue by product. The fee-yield table above is the closest available substitute, and it is a revenue measure, not a margin.
Neither can these records fix the boundary between contracted return and deferred loss inside the interest line, nor date the trough of the fee cycle. Those are questions for the chapters, which have the company's quarterly record and the analyst estimates to work with; this tab records the arena they take place in, and History records how this particular company arrived in it.
The arena and the evidence base
Korea Asset In Trust competes inside a closed regulatory perimeter. Only companies holding a Financial Services Commission trust licence under authorisation unit 4-121-1 may accept real-estate trust mandates, and at the FY2025 reporting date there were fourteen of them, KAIT included [1]. Two of the fourteen are themselves listed pure-plays: KAIT and Korea Real Estate Investment and Trust (KOREIT, 034830). The rest sit inside banks, financial holding companies, insurers, a securities house and a fashion group. That structure is what makes the competitive record here unusually legible — every licensee files the same regulator-collected fee and revenue data, and both listed pure-plays reprint it, so the whole field can be read from primary filings rather than estimated.
Three things follow for this tab. First, the head-to-head numbers below are the licensees' own submissions to the Korea Financial Investment Association, reproduced in KAIT's and KOREIT's annual reports — not a vendor screen. Second, KOREIT is the only rival for which a full like-for-like income statement, trust-fee book and order-mix disclosure exists in this corpus, so it carries most of the comparative weight. Third, three of the six staged comparators run different business models; they are described in their own section and kept out of the like-for-like economics.
Arena structure, value-chain economics and the property cycle belong to Industry; the raw document shelf is Competitors. What follows is the comparative record. Korean filings are quoted here in translation; each citation opens at the original passage.
Who overlaps where
Korean real-estate trust is not one market. It is a set of licensed products with very different economics, and rivals cluster differently across them. KAIT publishes a headline fee-rate card that separates them explicitly: borrowing-type (development) land trust is charged at 3.5% of pre-sale proceeds, trust-format redevelopment at 2.5%, completion-guarantee land trust at 1.5%, management-type land trust at 0.5%, and collateral trust at 0.2% of the beneficiary-certificate limit [2]. A seventeen-fold spread between the top and bottom product means the mix of mandates a firm wins matters more than the count.
Sources: KAIT fee-rate card and product descriptions, FY2025 annual report [3]; KAIT trust books by product [4]; KOREIT product lines and order mix [5], [6]; SK D and D business description [7]; KOREIT agency and REIT product descriptions [8]; KAIT redevelopment project count [9] and completion-guarantee project count [10].
The licensed products divide into two economically distinct groups. Collateral trust, pre-sale management trust and management-type land trust are compliance infrastructure — KAIT's own filing describes the non-borrowing products as goods that "must be used" to execute a property project, on the strength of the Trust Act's bankruptcy-remoteness provision [11]. They are near-universally supplied and priced at 0.2% to 0.5%. Borrowing-type land trust and trust-format redevelopment are the opposite: capital-intensive, restricted in practice to firms with equity to lend into the trust account, and priced at 2.5% to 3.5%. Where a firm sits on that split is the competitive question the numbers below answer.
Share of sector operating revenue, 2017–2025
The single most complete competitive series in the corpus is the fourteen-company operating-revenue table that KAIT reprints every year from the Financial Investment Association's disclosure site. Chained across the FY2021 and FY2025 annual reports it runs nine years.
Sources: derived from the licensee operating-revenue tables in KAIT's FY2021 annual report (2017–2021) [12] and FY2025 annual report (2021–2025) [13]; "2019 entrants" is the sum of Daishin Asset Trust, Shinyoung Real Estate Trust and Korea Investment Real Estate Trust. Figures are separate-financial-statement basis.
KAIT entered the window as the sector's second-largest firm by operating revenue, at 19.5% in 2017 against KOREIT's 22.2%, and exits it at 8.8% in 2025 — the smallest share it has recorded in the series. The path is not a smooth decline: revenue held at roughly ₩200bn to ₩219bn through 2020, dropped to ₩167.8bn in 2021, recovered to ₩209.1bn in 2023, then fell in each of the two following years to ₩146.3bn [14][15]. The sector's revenue pool, by contrast, grew from ₩1,032bn to ₩1,664bn over the same nine years. Share was lost to a larger pool, not only to a smaller numerator.
Two mechanical drivers are visible in the table. The Financial Services Commission licensed three new trust companies in 2019 — Daishin (July 2019), Shinyoung and Korea Investment (both October 2019) [16]. Their combined share went from 0.3% in 2019 to 10.8% in 2025. Across the full nine years KAIT's share fell 10.7 points. Separately, the licensee that appears as Asia Trust in the FY2021 report appears as Shinhan Asset Trust from FY2022 onward, carrying the same August 2007 establishment date; that platform went from 5.5% in 2019 to 11.8% in 2025, the largest gain of any incumbent.
The fourteen licensees, FY2025
The fourteen-licensee cross-section itself is in Industry; the table separates three facts that are usually conflated. On revenue KAIT ranks fifth. On fee income it ranks seventh of fourteen, at ₩61.7bn against Hana Asset Trust's ₩104.1bn, KB's ₩97.0bn and KOREIT's ₩97.9bn — the firm collects roughly 60% of the leader's fee income [17]. On capital it ranks second, at ₩867.2bn against KOREIT's ₩892.9bn, and holds 16.1% of the fourteen firms' combined ₩5,373bn of equity while earning 8.8% of their operating revenue [18].
Fee productivity per employee
The trust companies' own productivity yardstick — fee income divided by headcount — is published for every licensee each year on the same basis from FY2022 onward.
Sources: per-licensee fee-income and headcount tables, KAIT FY2022 [19], FY2023 [20], FY2024 [21] and FY2025 [22] annual reports. The FY2021 report's version of this table is populated with operating revenue rather than fee income, so the series starts in 2022.
KAIT's fee per head fell from ₩573m in 2022 to ₩388m in 2025, a 32% decline; the sector average fell 25% over the same span. The firm ran ahead of the sector average in every year and remains above it in 2025, but the gap narrowed from 23% to 10%. KB and Hana, both bank-owned, sit at ₩577m and ₩539m. KAIT reduced headcount from 208 to 159 across the four years, a 24% cut against the sector's 13%, which is why the ratio held up better than the fee income did [23][24].
KAIT against KOREIT, like for like
KOREIT is the only rival in this corpus that files a full pure-play trust income statement, a trust book by product and an order mix. The two firms are the sector's two largest capital bases, at ₩867.2bn of equity for KAIT and ₩892.9bn for KOREIT on a separate basis. KOREIT states in its own filing that it is "the company with the largest capital among the fourteen trust companies now in existence" and that it has "occupied a leading position in the industry for many years" on operating revenue, contract scale, operating know-how and manpower [25].
Sources: KAIT consolidated results and trust book by product, FY2025 annual report [26] and 1Q 2026 earnings release [27]; KOREIT summary consolidated financials [28] and trust book by product [29]. Yields derived from those two tables.
Three years of data move the two firms past each other on the fee line. In 2023 KAIT earned ₩95.4bn of trust fees against KOREIT's ₩76.6bn. In 2024 KOREIT passed it. By 2025 KOREIT earned ₩68.8bn against KAIT's ₩48.5bn — 42% more trust fee on a trust book less than half the size, ₩10,344bn against ₩22,630bn [30][31]. Narrowed to land trust alone, KAIT earned 0.39% of its land-trust principal in fees in 2025 against KOREIT's 1.23%, a gap that widened from 1.7 times to 3.2 times in two years.
The gap needs a definitional caution before it is used. Trust principal (수탁고) is the contracted amount at inception, not a marked AUM, and the fee rate attaches to the product type, not the principal: a book weighted toward borrowing-type land trust at 3.5% will show a far higher yield than one weighted toward management-type at 0.5%. KAIT's ₩10,604bn land-trust book contains only about ₩2.2tn of borrowing-type work [32]. The yield gap is therefore a statement about mix at least as much as about price.
On the operating line the direction reverses. KAIT's consolidated operating income fell from ₩116.7bn in 2023 to ₩34.2bn in 2025 but stayed positive in all three years; KOREIT swung from ₩33.9bn of operating income in 2024 to a ₩20.9bn operating loss in 2025 [33][34]. The firm with the better fee line took the larger charge below it.
What rivals say about this turf
Statements below come from the rivals' own filings and calls, in translation where the original is Korean.
KOREIT: a record order year in 2025. KOREIT terminated part of a treasury-share trust in December 2025 and distributed 2,961,902 shares as a special employee bonus. Its stated reason: "this was in consequence of achieving the largest order intake in 2025" [35]. The award carries a four-year lock-up on the employee stock ownership association tranche, releasing after December 2029. KAIT's own new fee contracts also rose in 2025, from ₩69.9bn to ₩98.1bn, so both firms were writing more business into the same year [36][37].
KOREIT: moving away from borrowing-type land trust. KOREIT states it is "moving away from a business structure centred on borrowing-type land trust in order to diversify its revenue structure", naming REITs, urban-redevelopment work and corporate rental housing as the destinations [38]. Its disclosed order mix shows the swing: borrowing-type land trust ran at 27.6% of orders in 2021, 1.9% in 2023 and 35.6% in 2025, while urban redevelopment ran at 31.2%, 62.0% and 50.9% in the same three years [39].
KOREIT: two new adjacent permissions. KOREIT registered loan brokerage and arrangement as an ancillary business on 14 June 2024, giving as its reason that "the property market downturn that began in 2023 is becoming prolonged" and that it needed new revenue sources [40]. In August 2025 it registered a second: advisory and consulting on funding structures for property development projects, explicitly including bridge and project-finance structuring — senior/subordinate ratios, loan-to-value and drawdown conditions — pitched at project sponsors and borrowers [41]. That is adjacent to the arranging and consulting fees KAIT books under "other fees".
Hana Financial: no fresh capital for the trust arm. Hana Asset Trust is the sector's largest fee-income earner. Asked on the January 2026 call whether "for your capital and asset trust businesses, you might need more capital to expand into certain lines of business", Hana's Group CFO answered that non-bank invested capital is already about ₩14.5tn for a 12% contribution to group profit, framed the plan as "normalisation" rather than growth, and said: "we're thinking injecting capital just at a level required to meet the regulatory threshold for the insurance arm and that's pretty much it. Otherwise, we will focus more on driving organic growth" [42][43]. Borrowing-type land trust capacity is a function of equity available to lend into trust accounts, so the parent's capital-allocation stance bears directly on how far that rival can push into KAIT's highest-rate product.
Hana Financial: the property book is still being cleaned. On the October 2025 call Hana's Group CRO said Q4 credit costs would rise from Q3 levels "because we still have real estate PF to clean up", and added that for the following year the group expects "an upward trend in delinquency and NPLs" [44]. That is the lender side of the same project-finance market KAIT's trust accounts lend into.
LF Corp: real-estate finance carried the group, and the downturn was felt. LF, which holds Koramco Asset Trust inside its financial segment alongside Koramco Asset Management and LF Investment [45], told shareholders that "the slump in the construction and property sectors persisted" and affected LF's businesses generally, while crediting expansion of real-estate finance AUM and cost reduction for the group's ₩1,882.4bn of revenue and ₩168.1bn of operating profit [46]. Koramco was the most profitable trust licensee in 2025, at ₩46.3bn [47].
Posted rates versus realised fees
KAIT's published fee-rate card is identical in the FY2021, FY2022, FY2023, FY2024 and FY2025 annual reports — 3.5% for borrowing-type land trust, 2.5% for redevelopment, 1.5% for completion-guarantee and lease-type, 0.5% for management-type and agency, 0.4% for pre-sale management, 0.3% for disposal, 0.2% for collateral and management trust. The only change across five filings is that the residual line was relabelled from "consulting" to "other (consulting etc.)" [48][49]. KOREIT publishes an equivalent card for collateral-trust disposal work on a sliding scale by disposal price: 8 per thousand up to ₩100m falling to 4 per thousand above ₩1bn for a lump-sum disposal, with each tier one to two per thousand higher on instalment terms [50].
Posted rates held; realised fees did not. The sector-wide land-trust fee pool and the sector-wide land-trust principal moved in opposite directions.
Source: sector fee and trust-asset tables reproduced in KAIT's FY2025 annual report from Financial Investment Association data [51], [52]; yields derived from those tables.
Across the fourteen licensees, land-trust fees fell from ₩894.4bn in 2022 to ₩468.6bn in 2025, a 48% decline, while the land-trust principal they hold rose 4.4% from ₩101,510bn to ₩105,959bn. Fee per unit of principal halved, from 0.88% to 0.44% [53][54]. What replaced that fee income in the sector's revenue composition is charted in Industry.
Since posted rates did not move, the halving is a mix effect, a base effect, or both: pre-sale proceeds are the fee base for every land-trust variant, so slower or smaller pre-sales shrink the fee on an unchanged rate, and a shift from 3.5% borrowing-type work toward 0.5% management-type work shrinks it again. The filings disclose the rate card and the outcome but not the realised rate on individual mandates, so the split between those two channels cannot be closed from this corpus.
KAIT's own product-level numbers show the same shape at firm level. Land-trust fees fell from ₩92.0bn in 2023 to ₩67.5bn in 2024 to ₩41.4bn in 2025 while its land-trust principal rose from ₩9,961bn to ₩10,604bn; collateral-trust fees rose from ₩2.0bn to ₩6.2bn as that principal went from ₩7,404bn to ₩10,709bn — growth concentrated in the 0.2% product [55].
Trust-format redevelopment
Both listed pure-plays have redirected new business toward trust-format urban redevelopment, in which the trust company is appointed project implementer for a reconstruction or redevelopment scheme in place of the traditional owners' union. KOREIT describes the mechanism plainly: the trustee takes title to the land from the union, then finances and executes the project using Korea Housing and Urban Guarantee Corporation loan guarantees or its own funds, reducing dependence on the construction contractor [56].
The order-mix series is charted in History; KAIT's redevelopment order intake went from ₩4bn in 2022 to ₩43bn in 2025, from 3% of new contracted fees to 44%. Conventional borrowing-type work fell from ₩38bn to ₩16bn over the same four years [57]. The disclosed pipeline stands at 22 named schemes — six on the trust-agency structure and sixteen on the trust-operator structure — covering 19,800 existing households to be rebuilt as 33,081, including Mok-dong blocks 9 and 11 in Seoul, Yeouido Sibum and Gwangjang, and Gwangmyeong Jugong 10 and 11 [58].
KOREIT ran 50.9% of its 2025 orders through the same channel [59]. Its redevelopment weighting is far more volatile than KAIT's — 62.0% in 2023 collapsing to 7.2% in 2024 and rebounding to 50.9% — which is consistent with lumpy, tender-by-tender competition rather than a steady book.
The other contested adjacency is REIT asset management. KAIT manages 18 live REITs with ₩5,124.8bn of assets and earned ₩4.1bn of AMC fees in 2025, up from ₩3.4bn in 2024; the single largest vehicle is the MDM REIT at ₩1,997.4bn, approved in 2024 [60]. REITs supplied 5.7% of KOREIT's 2025 orders against 34.3% in 2024 [61].
The 2016 baseline
The IPO documents fix where the field stood before the current cycle, which is the only way to read the share series above as movement rather than level. In 2015 KAIT held about 20% of sector trust order intake and roughly 30% of borrowing-type land trust orders, at ₩126.8bn out of a ₩419.1bn market; KOREIT held 38% of the borrowing-type market that year and 48% in 2014 [62][63]. The prospectus described borrowing-type land trust as work that only "some trust companies with capital, operating experience and risk-management systems" among the then eleven licensees could perform, and stated that KAIT recorded "a share of about 30% of the borrowing-type land trust market as at the end of 2015" [64].
Two structural things changed after that. The licensee count went from eleven to fourteen. And the redevelopment opportunity the prospectus was underwriting — it sized the sub-1,000-household reconstruction market at about ₩45tn [65] and projected trust companies taking 10% of it with KAIT taking 30% of that, for about ₩40.5bn of fees [66] — is the same channel both listed pure-plays are now competing in directly.
Switching, duration and contractual lock
Real-estate trust does not switch like a service contract, because the trustee holds legal title.
Sources: KAIT FY2025 annual report, trust concept and functions [67], market and outlook [68], fee-rate card [69], recognition period [70] and contingencies note [71]; IPO prospectus recognition description [72]; redevelopment appointment note [73]; KOREIT disposal-fee scale [74].
Three consequences for competitive dynamics follow from those terms. Contracts are project-length rather than renewable: a mandate ends when the development completes, so the field re-competes for every new project rather than defending a renewal. Order intake therefore leads revenue by three to four years — KAIT's ₩226.4bn of 2021 contracted fees, ₩124.6bn in 2022, ₩73.2bn in 2023, ₩69.9bn in 2024 and ₩98.1bn in 2025 sets the fee line for the years after each [75][76][77][78][79]. And winning the high-rate products consumes balance sheet: KAIT's loans to trust accounts ran from ₩224bn in 2022 to ₩819bn in 2024 before falling to ₩739bn at 1Q 2026, against six borrowing-type contracts written in 2025 on ₩1,883bn of total project cost [80].
A change in what the company claims as its advantage
The competitive-advantage section of KAIT's annual report is a stable text that changed once. Through FY2023 it stated that the company "refers to sales-viability and business-feasibility consulting reports prepared directly by affiliated companies when reviewing whether to accept a mandate", naming MDM and MDM Plus as the source of that development know-how [81]. From FY2024 that sentence is absent; the paragraph now rests on in-house specialist staff and internal process, funding and risk-management systems, while the group one-stop-service claim in the paragraph above it is retained [82][83]. The filings do not explain the deletion. It is recorded here because the affiliate-underwriting link is the differentiator most often attributed to this company, and the company itself stopped asserting it from the FY2024 report onward. The underwriter's 2016 assessment had rested on the same link, describing MDM's feasibility consulting as what gave KAIT a competitive edge over other firms in development-trust risk management [84].
Comparators used, and comparators set aside
Sources: KAIT fourteen-licensee table [85]; KOREIT self-description [86]; LF segment structure [87]; SK D and D business description [88]; Hulic and TOC selection recorded in the 2016 IPO valuation screen [89].
Two evidence limits are worth stating plainly. There are no KAIT earnings-call transcripts in this corpus — the company runs invitation-only institutional meetings using the quarterly deck, so no management answers on competitive dynamics exist to quote. The second — the slight disagreement between KAIT's and KOREIT's reproductions of the same Financial Investment Association data — is carried in Industry.
The Record and Its Breaks
Korea Asset In Trust was incorporated in March 2001 as Kookmin Asset Trust, a wholly-owned vehicle of the state bad-bank KAMCO [1], and began operating one month later by absorbing twelve land-trust projects from the collapsed Koret Trust [2]. Four breaks define the twenty-five years since: the KAMCO carve-out and distressed-portfolio transfers of 2001–02; the change of control that moved the company from the state to Daishin and then to developer MDM and its founder Moon Ju-hyun in July 2011 [3]; the KOSPI listing on 13 July 2016 [4]; and the property-development downturn that took operating income from ₩146.9 billion in 2022 to ₩34.2 billion in 2025 [5].
This tab records what was said and what followed. One structural note about the sources: KAIT holds no earnings call and publishes no transcript, so every promise below comes from a filing, an IPO document, or one of the twelve quarterly investor decks in the corpus, which begin only in August 2023. For periods before that, the annual business report is the sole management-voice record. Who runs and owns the company today sits in People; the named-rival record sits in Competition.
Incorporated
KOSPI Listing
Shares Outstanding
Market Cap (₩bn)
Sources: FY2021 Annual Business Report, company history [6]; FY2025 Annual Business Report, listing status and share count [7] [8]; market capitalisation as reported at 7 August 2026.
The Arc in Dated Beats
The chronology below is built from the company-history tables in the annual business reports, extended after 2016 with the bond, treasury and board records in those same reports, the quarterly decks and the dated news record. Two things are worth noting about the annual-report table itself. First, the FY2021 report listed thirty entries running to 2020; the FY2025 report lists seventeen and stops at the 2016 listing, dropping every capital raise, every stock dividend, all three distressed-portfolio transfers and the asset-management subsidiary formation [9] [10]. Second, the FY2025 report states there was no change of control, no merger, no reorganisation proceeding and no change of principal business during its disclosure period [11].
Sources: FY2021 Annual Business Report, company history and subsidiary history [12] [13]; IPO prospectus, offering terms [14]; FY2025 Annual Business Report, board changes, treasury cancellation and bond record [15] [16] [17] [18]; 2Q 2023 investor presentation, loan-type land trust order history [19]; news record for the 2026 leadership change [20] and for the 2024 bond attempt [21].
The controlling-shareholder table records the ownership sequence in full: KAMCO from 20 March 2001, Daishin MSB from March 2010, a Daishin private-equity vehicle from 11 July 2011, and MDM Co with Moon Ju-hyun from 12 July 2011 — a one-day handoff [22]. The related-party bloc around MDM has been added to and trimmed nine times since, most recently in April 2020 [23].
What the Company Earned
Reported revenue peaked at ₩259.1 billion in FY2023 and has fallen for two consecutive years, to ₩204.3 billion in FY2025. Operating margin fell in every year from FY2020 — 74.4%, 69.6%, 63.0%, 45.0%, 22.9%, 16.8% — a six-year compression with no interruption. Net income does not track it: FY2023 net income rose 19.8% to a record ₩129.6 billion while operating income fell 20.5%, and FY2025 net income rose 32.0% to ₩49.4 billion while operating income fell 33.9% [24].
Sources: 4Q 2025 investor presentation, six-year performance table [25]; 2Q 2023 investor presentation for FY2018–FY2019 [26].
Management publishes a second return measure alongside reported ROE: an adjusted ROE on a separate-entity basis that charges the year with the movement in the regulatory loan-loss reserve. The two series diverge sharply from FY2023. Reported ROE was 13.2% in FY2023 while adjusted ROE was 1.35%; reported ROE was 3.60% in FY2024 while adjusted ROE was negative [27] [28]. In FY2025 the relationship inverts: adjusted ROE of 9.51% against reported ROE of 4.64%, because ₩45.3 billion of the reserve built in FY2024 was scheduled for reversal [29] [30].
Sources: FY2022, FY2023, FY2024 and FY2025 Annual Business Reports, key management indicators [31] [32] [33] [34].
The FY2024 adjusted ROE was published twice with two different values. The FY2024 report gave −6.35% on adjusted net income of −₩47.46bn; the FY2025 report restated the same year to −6.55% on −₩48.96bn. Neither report explains the change.
Sources: FY2024 Annual Business Report, key management indicators [35]; FY2025 Annual Business Report, key management indicators [36].
Management Said, and What Followed
The ledger below pairs each dated commitment with the outcome the filings later reported. Because there is no call record, the commitments are drawn from the IPO use-of-proceeds statement, the quarterly decks and the annual management discussion. Every row names the period the promise covered and the basis on which it was measured.
Sources: IPO prospectus use of proceeds [37] and issuance-results report [38]; 3Q 2023 investor presentation, funding plan [39]; 4Q 2024 investor presentation, shareholder-return note [40]; FY2022, FY2023, FY2024 and FY2025 management discussion [41] [42] [43] [44]; 1Q 2026 investor presentation [45]; FY2024 Annual Business Report, summary financial information for the borrowings figures [46]; 1Q 2026 investor presentation for the order mix and trust-account loan balances [47]; 2Q 2023 investor presentation for the Yeouido Sibeom household count [48]; news record for the Yeouido bidding [49] and the 2024 apology [50].
The trust-account loan balance is the clearest single test in that ledger, because the company put a number on it. In November 2023, with the balance at ₩441 billion, the deck stated a year-end figure of approximately ₩350 billion and described the 2023 funding plan as resting on the increase in equity [51]. The balance closed 2023 at ₩469 billion, reached ₩819 billion at end-2024, and stood at ₩739 billion at 1Q 2026 [52].
Sources: 3Q 2023 investor presentation for 2019–2021 [53]; 1Q 2026 investor presentation for 2022–1Q 2026 [54].
The classified-asset series that moved with that balance is carried in Provisions and Profit.
Capital Allocation
The company has raised equity once as a public issuer, in 2016, and has never returned to the market for it. The IPO sold 27,297,345 shares at ₩10,300 for a gross ₩281.2 billion, but only 11,512,480 of those shares were newly issued: 57.8% of the deal was a secondary sale, and ₩162.6 billion went to selling shareholders rather than to the company [55] [56]. Net proceeds to KAIT were ₩116.9 billion [57]. KAMCO cut its stake from 18.51% to 6.40% in the offering; the employee stock ownership association took up 351,897 of the 5,459,469 shares reserved for it, or 6.4% of its allocation [58].
Sources: FY2021 Annual Business Report, company and subsidiary history [59] [60]; IPO prospectus and issuance-results report [61] [62] [63]; FY2025 Annual Business Report, bond record, use of proceeds, equity statement, treasury cancellation and reserve notes [64] [65] [66] [67] [68]; 1Q 2026 investor presentation, subsidiary results [69]; news record for the 2025 bond book [70].
The dividend record runs unbroken for eleven consecutive year-end payments covering 2015 through 2025 [71]. Its level is not unbroken. The cash dividend was ₩200 per share for FY2016–FY2019 alongside a stock dividend, ₩220 for FY2020–FY2023, ₩100 for FY2024, and ₩150 for FY2025 [72] [73]. Payout ratio rose as earnings fell, from 21% in FY2023 to 33% and 37% [74]. Total cash paid was ₩26.9 billion for FY2023, ₩12.2 billion for FY2024 and ₩18.4 billion for FY2025 [75].
Sources: FY2025 Annual Business Report, dividend history [76]; 2Q 2023 and 4Q 2025 investor presentations for the pre-2023 dividend and payout series [77] [78].
The Book the Company Was Winning
New fee mandates are the leading indicator management publishes, and the composition of that number changed more than its level. Total contracted fees fell from ₩226.4 billion in 2021 to ₩73.2 billion in 2023, then recovered to ₩98.1 billion in 2025 [79] [80]. Within the loan-type land trust line, conventional mandates fell from ₩38 billion in 2022 to ₩16 billion in 2025 while redevelopment mandates went from ₩4 billion to ₩43 billion — the recovery is entirely a mix shift [81].
Source: 1Q 2026 investor presentation, contracted trust and REIT fees [82].
The redevelopment pipeline the decks disclose grew through the downturn without interruption. Households in mandates at reserve-trustee stage or beyond went from 11,662 in August 2023 to 19,800 by May 2026, against a planned post-completion count that rose from 19,889 to 33,081 [83] [84]. The decks caution that the list excludes projects at consultation stage and that entries are subject to change [85]. Total trust assets under management, the other scale measure, moved much less: ₩19.4 trillion at end-2021 and ₩22.6 trillion at end-2025, with loan-type land trust assets inside it falling from ₩2.5 trillion to ₩2.2 trillion [86] [87].
Sources: 2Q 2023, 4Q 2023, 4Q 2024 and 1Q 2026 investor presentations, reconstruction project tables [88] [89] [90] [91].
How the Explanation Changed
The account management gave for the earnings decline moved through four distinct stages in four annual reports. The wording is worth setting side by side, because the cause named in each year is different and the sequence runs steadily inward, from world interest rates to the company's own geographic concentration.
March 2023, on FY2022: "the pandemic ended and private consumption was expected to recover, but only briefly; as global rate-hiking and domestic and overseas economic uncertainty spread, the domestic property market contracted rapidly." Net income was said to have risen 0.73% "as a result of the company responding pre-emptively to risk" [92].
March 2024, on FY2023: the year is described as one in which "successive defaults and bankruptcies of developers and contractors" raised fears of project-finance impairment. Net income rose 19.8%, attributed to dividend and interest income rather than fees, while adjusted ROE fell 8.22 percentage points to 1.35% [93].
March 2025, on FY2024: "a triple bind of interest-rate rises, worsening inflation and a construction slowdown." For the first time the report names the mechanism inside its own income statement: "the main reason for the decline in operating income is the increase in credit-loss provisions" [94].
March 2026, on FY2025: "the capital-region property market showed a gradual recovery, while the non-capital regions where the company's main projects are concentrated continued to carry a high share of unsold housing, and regional polarisation deepened" [95].
The industry-outlook section of the same reports moved on a different clock. Its opening sentence blamed household debt and the government's cooling measures plus rising trade protectionism in the FY2021 report [96]; then ran verbatim across three consecutive reports — FY2022, FY2023 and FY2024 all open "the property development market has recently contracted amid the global interest-rate hiking trend and the spread of domestic and overseas economic uncertainty" [97] [98] [99]; and changed only in the FY2025 report, which for the first time named project finance in that sentence: "amid complex factors including the widening concern over project-finance impairment" [100]. One sentence in that section did not change at all across FY2022 through FY2025: that if the company applies its experience and risk-management capability in loan-type land trust well, it can create new opportunities even in a difficult environment [101] [102].
Sources: FY2021 through FY2025 Annual Business Reports, industry outlook and management discussion sections [103] [104] [105] [106] [107] [108]. Intensity is the writer's coding of whether a theme is absent, present or leading in that year's text.
Definitions That Moved
Three of the metrics a reader would use to track this record were redefined or restated during the period, in each case without a reconciliation note in the source.
Sources: 4Q 2025 and 1Q 2026 investor presentations, trust order tables [109] [110]; FY2024 and FY2025 Annual Business Reports, key management indicators [111] [112].
Where the Record Runs Out
Three gaps are worth naming, because chapters citing this tab will hit them.
The 2020–21 injections that took Korea Asset Capital's paid-in capital from ₩60 billion to ₩200 billion are recorded as dated events, but no return on that ₩140 billion is disclosed anywhere in the corpus [113]. The subsidiary's standalone results appear in the decks from 2023 onward — ₩7.7 billion of net income in 1Q 2026 on ₩471.2 billion of equity — but there is no bridge between the capital put in and the profit that came out [114].
The REIT book carries ₩5,124.8 billion of assets under management across eighteen funds, sixteen with approval years running from 2012 to 2024 and two still in progress. One of them, MDM REITs, is ₩1,997.4 billion, or 39% of the total [115]. The management fee that book produces is disclosed as a single annual figure for the whole book — ₩4.1 billion in 2025 — and never split by fund, so the fee attaching to the MDM vehicle cannot be separated from the other seventeen [116].
And the ₩60 billion transferred from share premium to retained earnings in 2025 is recorded in the statement of changes in equity with no stated purpose [117], in the same year the company reversed ₩45.3 billion of loan-loss reserve [118] and raised the dividend 50% [119]. The appropriation statement does link the two: its footnote records the cash dividend as payable out of the capital reserve transferred into retained earnings, under Article 461-2 of the Commercial Act [120], read in Provisions and Profit.
Control and incentives, in one frame
Korea Asset In Trust has one class of shares, one voting bloc, and no equity compensation of any kind. The MDM group and its principals hold 54.24% of the votes and 54.24% of the economics — control and ownership are the same number here, which is unusual and simplifies the map [1]. What the map does not simplify is where the money reaches the top: management is paid in cash salary and cash bonus, while the controlling family is paid in dividends on a stake worth roughly ₩154bn at the 7 August 2026 close.
Three dated facts frame everything below. The board shrank from six directors to four at the March 2026 AGM, and the sole inside director now chairs it and runs the company [2]. Kim Kyu-chul, representative director since 2012, left at term expiry on 28 March 2026 after the longest CEO tenure in the sector [3]. And on 12 February 2026 the Financial Services Commission issued the company an institutional warning with a ₩174m administrative fine, alongside a dismissal-equivalent sanction on a former executive vice president who had already been convicted of taking bribes [4].
Who holds the votes
Control bloc (votes = economics)
Held by small shareholders
Small shareholders
Share classes
Sources: Q1 FY2026 quarterly report, largest shareholder and related persons, base date 31 March 2026 [5]; FY2025 annual report, share distribution, base date 31 December 2025 [6]; FY2025 annual report, total shares outstanding [7].
Sources: Q1 FY2026 quarterly report, largest shareholder and related persons, base date 31 March 2026, and MDM ownership (Moon Ju-hyun 95%, Min Hye-jung 5%) [8]; values derived at the ₩2,325 close of 7 August 2026 from company price data.
Moon Ju-hyun's look-through economics run to roughly 42.6% — 15.31% held directly plus 95% of MDM's 28.76% — before any account of MDM Plus, whose own shareholder register is not disclosed in Korea Asset In Trust's filings [9]. He has never held a seat on this board or any of its committees; the 2016 listing prospectus already described him as chairman of the group standing behind MDM [10]. MDM itself is a substantial operating company in its own right: ₩1,643.2bn of assets, ₩1,268.0bn of equity and ₩36.2bn of FY2025 net income on a consolidated basis [11]. Korea Asset In Trust is the only listed member of the 24-company MDM group [12].
Five years in which the bloc bought nothing and sold nothing
Sources: annual reports FY2021 [13], FY2022 [14], FY2023 [15], FY2024 [16] and FY2025 [17]; Q1 FY2026 quarterly report [18].
MDM has held exactly 35,200,618 shares and MDM Plus exactly 12,397,775 shares in every year from 2021 through the first quarter of 2026 [19] [20]. Moon Ju-hyun's personal line moved once in five years, by 260 shares, in 2022 [21].
The step from 53.62% to 54.34% in 2025 was therefore not a purchase. On 26 March 2025 the company cancelled 1,603,826 treasury shares carried at ₩12,562m, cutting shares outstanding from 123,977,752 to 122,373,926 — the filing states the year-end percentages moved because of that cancellation [22] [23]. The 0.10pp step back down in the first quarter of 2026 is the removal of Kim Kyu-chul's 120,580 shares from the related-persons table on his term expiry, not a market sale by the family [24].
No shares held by any member of the control bloc are disclosed as pledged or otherwise encumbered in any of the five annual reports. The only share-related collateral in the filings is a ₩50m deposit lodged with Korea Securities Finance against the employee stock ownership association's acquisition loan [25].
What a minority holder can and cannot do
Sources: FY2025 annual report, voting systems and voting rights, base date 31 December 2025 [26]; FY2025 annual report, AGM minutes summary for the 22nd through 24th meetings [27].
Cumulative voting is excluded, so a minority holder cannot concentrate votes to seat a director. With 54.24% in one aligned bloc, ordinary resolutions and director elections are decided before the meeting opens; the special-resolution threshold of two-thirds is the only vote the bloc cannot carry alone. The audit-committee director election is the one structural check Korean law supplies — the 3% rule caps each large shareholder's votes in that election — and the company's own board rules add that removing an audit committee member requires a two-thirds board vote [28]. Across the 22nd, 23rd and 24th AGMs the filings record no shareholder proposal and no dissent [29].
The board, and how it got smaller
Sources: board composition tables in the FY2021 [30], FY2022 [31], FY2023 [32], FY2024 [33] and FY2025 [34] annual reports, and the Q1 FY2026 quarterly report [35].
The board peaked at seven directors in 2023 and stands at four. At the 25th AGM on 26 March 2026, Choi Jin-young and Han Sung-hee were re-elected while Kim Kyu-chul and Lee Gun-ki reached term expiry on 28 March 2026 and were not replaced, taking the count from six to four and disclosed independence from 66.7% to 75% [36] [37]. Over the same window the outside bench turned over completely: Kim Chung-sik, Min Sang-ki and Song Kyung-chul all left in March 2024, Park Jae-young in March 2025, Lee Gun-ki in March 2026 [38] [39]. Of the three outside directors now serving, the longest has been on the board three years.
Sources: Q1 FY2026 quarterly report, board composition and executive roster, base date 31 March 2026 [40] [41]; FY2025 annual report, audit committee membership and expert designation [42].
The audit committee is three outside directors, chaired by the only member designated an accounting or finance expert. Chair and CEO are the same person, and the annual report gives the reason plainly: expertise and efficiency in running the board [43]. Kwon Jun-hak carries the lead independent director designation [44].
Two facts sit alongside the disclosed independence designations rather than contradicting them. Choi Jin-young served as a non-standing adviser to Garip Accounting Corporation, a firm the company retains for advisory work; the filing states his committee duties are unrelated to that engagement [45]. And Song Kyung-chul, an outside director and audit committee chair until his mid-term resignation on 22 March 2024, appeared in the largest shareholder's related-persons table holding 6,413 shares throughout his tenure [46] [47].
Attendance, 2025
Sources: FY2025 annual report, board resolutions and attendance across ten meetings [48]; FY2025 annual report, audit committee activity across eight meetings [49].
The board met ten times in 2025 and the audit committee eight; the filings record every resolution as carried, with no dissenting vote by any director in either body [50] [51]. Outside directors received quarterly management briefings [52] and one external audit-committee training session, delivered in June 2025 [53].
Three board committees the company does not run
Source: FY2025 annual report, board committee composition and reasons for non-operation [54].
The exemption is size-based and the company states the threshold it is waiting on: it will establish the three committees once assets exceed ₩2tn or total trust assets exceed ₩20tn [55]. The practical consequence is that the same four-person board nominates its own members and sets its own pay within the ceiling shareholders approve, and that risk oversight sits in a management committee rather than a board one. The board's own regulations do reserve interested-party transactions, bad-debt write-offs above ₩1bn, and any acquisition or disposal above ₩1bn to full board approval [56] [57]. Compliance and risk management are combined in one officer, Min Chul-hyun, who serves as both chief compliance officer and head of the risk management division [58].
Operators
Sources: Q1 FY2026 quarterly report, executive roster at 31 March 2026 [59]; FY2025 annual report, executive roster at 31 December 2025 [60]; FY2023 annual report, officer appointments effective 1 January 2024 [61].
The succession was internal and long-signposted. Shin Chan-hyuk joined in December 2015, rose through executive vice president to president, was elected an inside director at the March 2025 AGM, and took the representative-director role and the chair a year later [62] [63]. The one-year overlap as co-inside-director is the clearest handover the filings record.
Beneath him the bench thinned. Nine unregistered executives were in post at end-2024 and six at end-2025, with two retiring in August 2025 [64] [65]. Aggregate unregistered-officer pay went ₩3,432m across eight officers in 2023, ₩2,958m across nine in 2024, then ₩2,150m across six in 2025 [66] [67] [68]. Headcount followed: 203 employees at end-2022, 149 at end-2025 [69] [70].
Cho Hyun-bin is the only officer with a disclosed family connection to the controller — the filings record the relationship as 인척, a relative by marriage. He joined the officer ranks on 1 January 2024 as head of the management strategy office after six years as a general manager, and by end-2025 was running the corporate support division, which covers finance, planning and disclosure [71] [72]. He is 41 and holds no shares.
What the pay actually pays for
Sources: FY2025 annual report, individual pay calculation basis [73]; FY2023 annual report, top-five pay including monthly sales incentives [74]; FY2021 and FY2022 annual reports confirming no stock options granted or exercised [75] [76]; FY2025 annual report, share-based payment transactions with major shareholders [77].
There is no equity in the package, so the usual apparatus of strike prices, vesting schedules and hurdle tests does not exist here. Nothing vests, nothing is deferred, and nothing can be clawed back. The whole variable component is one cash bonus, sized by a payout rate set against the previous year's results.
Sources: individual compensation disclosures in the FY2021 [78], FY2022 [79], FY2023 [80], FY2024 [81] and FY2025 [82] annual reports.
Salary is a ratchet that stopped: ₩700m, then ₩800m, ₩800m, ₩830m, ₩830m [83] [84]. The bonus is where the operating cycle shows. It fell from ₩667m in FY2023 to ₩204m in FY2025, a 69% cut, over the same span in which operating margin went from 63.0% to 22.9% in the years those bonuses were measured against. The one break in the pattern is FY2023, when the bonus rose 35% on a prior-year margin that had fallen 6.6 percentage points [85] [86]. Because the payout is struck on the preceding year, the FY2025 bonus of ₩204m is the board's read on FY2024, not on FY2025.
Sources: board and employee compensation tables in the FY2021 [87], FY2022 [88], FY2023 [89], FY2024 [90] [91] and FY2025 [92] [93] annual reports; ratio derived from those two series.
The CEO-to-average-employee ratio has stayed in a band of 9.9x to 11.9x for five years — narrow by the standards of listed financials, and it narrowed further in FY2025 because the CEO's bonus fell faster than staff pay. Shareholders raised the director pay ceiling from ₩2.0bn to ₩3.0bn between 2021 and 2023 and have held it there; actual payments have run at 59% to 73% of the ceiling [94]. Outside directors averaged ₩54m in 2025, the lowest of the five years [95].
One design feature runs deeper into the business than the CEO line shows. Divisional heads are paid a monthly incentive struck on cash received when a mandate is won: in FY2023 that component was ₩157m and ₩193m for two executive vice presidents, on base salaries of ₩230m and ₩240m [96]. It pays on origination, while the completion-guarantee obligations those mandates carry sit on the company's balance sheet for years afterwards — a timing mismatch the disclosures state but do not address. How that guarantee exposure works is set out in Business.
How the controlling family is actually paid
Source: FY2025 annual report, dividend history for the 23rd through 25th fiscal years [97]; bloc share derived by applying the year-end control-bloc percentage to the declared total.
The FY2025 dividend of ₩150 a share totals ₩18,355m, a 37.2% consolidated payout and the eleventh consecutive year-end dividend since listing [98] [99]. Roughly ₩9,956m of it goes to the control bloc, of which Moon Ju-hyun's direct 15.31% holding alone collects about ₩2,810m — some 2.7 times the departing CEO's entire ₩1,037m FY2025 pay package [100] [101]. The controller's incentive here is the dividend and the buyback, not the pay table. The company also names the 2025 treasury cancellation as part of the same shareholder-return policy [102]. What that mix has meant for capital allocation over time belongs to History.
The related-party ledger
Sources: related-party transaction notes in the FY2021 [103] [104], FY2022 [105] [106], FY2023 [107] [108], FY2024 [109] [110] and FY2025 [111] [112] annual reports; percentages derived against reported operating revenue.
Related-party revenue has been a stable 4% to 6% of operating revenue for five years, and the 2016 listing prospectus put the same ratio at 5.85% for the first quarter of 2016 — the dependence is old and it has not grown [113] [114]. MDM Plus is the single largest counterparty every year, contributing ₩6,899m in FY2025 across trust contracts, interest income and advisory fees [115].
The balance-sheet side is the part that changed. Related-party receivables went from ₩5,564m at end-2022 to ₩83,779m at end-2023, and the whole step is a new loan to MDM Plus of ₩70,917m [116] [117]. That loan was drawn down to ₩51,000m by end-2024, then increased again by a fresh ₩6,000m advance in 2025 to ₩56,914m, carrying a ₩190m allowance [118] [119] [120]. A ₩10,000m loan to affiliate The M Retail was repaid in full during 2025, and ₩305m of loans to affiliate-company officers went to zero [121].
Two counterweights belong in the same paragraph. The flow runs both ways: MDM, MDM Plus and affiliate One Twenty Five PFV have given the company payment guarantees of ₩15,280m, ₩80,685m and ₩109,566m respectively against down-payment and interim-payment loans it extended to purchasers [122]. And the statutory disclosures on transactions with major shareholders report nothing at all: no credit extension, no asset transfer, no business transaction reaching 5% of revenue, and no share-based award, in the period from the start of the fiscal year to the filing date [123]. The MDM Plus loan sits below that threshold and is disclosed in the notes rather than in that section. Two board resolutions in 2025 — on 9 May and 19 December — were captioned "transactions between interested parties and the company" and carried unanimously [124].
Sources: FY2023 [125], FY2024 [126] and FY2025 [127] related-party notes.
Total key management compensation peaked at ₩7,022m in FY2023 and fell 24% the following year, tracking the reduction in the officer bench rather than a change in individual terms [128] [129]. Separately, ₩2,628m of housing and similar loans to officers and employees was outstanding at end-2025 [130].
Insider activity
Sources: largest-shareholder tables in the FY2022 [131], FY2024 [132] and FY2025 [133] annual reports and the Q1 FY2026 quarterly report [134]; treasury cancellation from the FY2025 annual report [135]; Kim Kyu-chul's disposal on retirement from Korean press coverage of the March 2026 filing [136].
Insider dealing here is close to non-existent. Across five annual reports the filings record no open-market purchase and no open-market sale by any controlling shareholder or director; every movement in the tables is an appointment, a retirement, or the treasury cancellation. The company also reports no short-swing profit events requiring disgorgement [137]. Employee stock ownership association holdings have drifted down from 0.43% in 2021 to 0.23% in 2025 [138] [139]. One other shareholder change is worth recording: Korea Asset Management Corporation, the state agency that founded the company in 2001, still held 5.72% at end-2023 and no longer appears in the 5%-holder table from end-2024 [140] [141].
Officer and regulator docket
Sources: FY2025 annual report, financial supervisory and other agency sanctions [142]; Q1 FY2026 quarterly report, sanctions status at 31 March 2026 [143].
The filings identify sanctioned individuals by office and length of service, not by name. Two points can be stated without inference. The representative-director office was held without interruption by Kim Kyu-chul from 2012 until 28 March 2026, so both the January 2024 caution and the May 2024 cautionary warning attach to the office he then occupied [144] [145]. And five separate regulatory actions in thirty-two months, three of them naming individual officers, is a dense record for a company of 149 employees.
The most serious item is not an allegation but a concluded criminal matter. The former executive vice president sanctioned on 12 February 2026 was convicted at first instance by the Seoul Central District Court under the Act on the Aggravated Punishment of Specific Economic Crimes for receiving bribes. The judgment became final on 10 June 2025: three years and six months' imprisonment, a ₩50m fine and ₩55m in forfeiture. The FSC's dismissal-equivalent sanction followed eight months later, against an officer who had by then already left.
Source: FY2025 annual report, sanctions footnote to the 12 February 2026 action [146].
The company's stated remedial steps are internal control reinforcement and training in each case, with fines paid and the January and May 2024 personal actions marked completed [147]. The two individual actions from February 2026 were still marked pending at the Q1 2026 filing date [148]. The compliance function that monitors officer and employee securities trading — the subject of the March 2025 reprimand — reports quarterly checks and rates every period "appropriate" [149].
Separate from the officer docket, the company carries a large but routine litigation load arising from its position as registered owner of trust property: 346 suits against it with a claimed value of ₩540,456m and 80 suits it has brought worth ₩141,172m at the end of the first quarter of 2026, none of which management considers capable of materially affecting the business [150]. The 2016 prospectus described the same structural feature, with a roughly 90% win rate on concluded cases and losses generally borne by trust assets rather than the company's own [151].
Business
Korea Asset In Trust is paid a percentage of apartment pre-sale proceeds for developing land it does not own, and in its highest-fee product it also lends the construction cost into the trust account it manages. Fee income has fallen from 56% of revenue in FY2021 [1] to 31% in FY2025; interest income is now the largest single revenue line. Operating profit was ₩34.2bn on ₩204.3bn of revenue [2].
What the company sells
The company is a licensed trustee. A landowner, developer or owners' union transfers legal title to a plot; Korea Asset In Trust arranges the permits, appoints the contractor, runs the pre-sale, collects the money and hands back the surplus. The arena, the licence perimeter and the vocabulary are set out in Industry; what matters here is the price and the base it is charged on.
Every product is priced as a rate applied to a specified base, and for the development products that base is pre-sale proceeds — 3.5% for a borrowing-type land trust at the top of the card, against 0.2% of the secured limit for a collateral trust at the bottom [3]. The two land-trust structures differ in one variable: in a borrowing-type trust the trustee funds the construction cost itself and earns the larger fee for doing so; in a management-type trust the settlor or the contractor funds it and the fee is correspondingly smaller [4].
Two accounting facts follow from that pricing and govern everything else in this chapter. First, the company keeps its own books and the trust accounts separate, and lending transactions, interest and trust fees pass between the two [5]. Second, a land-trust fee is not earned on signature: it is apportioned evenly across the entire trust period, which the company puts at three to four years [6]. Of ₩63.2bn of FY2025 fee income, ₩55.8bn was recognised over time and only ₩7.4bn at a point in time [7]. Reported fee revenue is therefore the amortisation of contracts signed two to four years earlier, and its base only materialises if the units actually sell.
The revenue engine has changed
Source: FY2025 Annual Report, Consolidated Statement of Comprehensive Income (FY2023–FY2025) [8]; FY2022 Annual Report, Consolidated Statement of Comprehensive Income (FY2021–FY2022) [9].
Group revenue fell 3.9% over four years, from ₩212.5bn to ₩204.3bn. The composition moved much further. Consolidated fee and commission income — the basis used throughout this chapter, against the ₩61.7bn separate-basis figure in the fourteen-licensee table in Industry and the ₩48.5bn trust-fee line in Competition — dropped 47%, from ₩119.5bn to ₩63.2bn, while interest income rose 77%, from ₩62.3bn to ₩110.3bn — 29.3% of revenue in FY2021, 54.0% in FY2025 [10] [11].
Land trust is ₩41.4bn of the ₩63.2bn of FY2025 fee income, and the decline sits there: ₩77.1bn in FY2021, ₩92.9bn in FY2022, then ₩92.0bn, ₩67.5bn and ₩41.4bn [12] [13]. What did not fall is the asset base. Land-trust principal under management was ₩9,335bn at end-FY2021 and ₩10,604bn at end-FY2025; total trust principal across all five trust types rose to ₩22,630bn [14] [15]. Land-trust fee income divided by land-trust principal fell from 0.83% to 0.39% over the same period — the company kept the assets and stopped being paid on them, because the fee base is pre-sale proceeds and pre-sales stalled. The peer comparison for that yield sits in Competition.
The line that replaced it is trust-account loan interest: ₩23.5bn in FY2021, ₩12.7bn in FY2022, then ₩25.0bn, ₩45.0bn and ₩51.5bn in FY2025 [16] [17]. In FY2025 the company earned more interest from lending into its own trust accounts (₩51.5bn) than it earned in land-trust fees from managing them (₩41.4bn).
The loan inside the fee
Source: FY2025 Annual Report, Note 10 Financial assets at amortised cost — trust account loans (FY2024–FY2025) [18]; FY2023 Annual Report, Note 10 Financial assets at amortised cost — trust account loans (FY2022–FY2023) [19].
Between the start of FY2023 and the end of FY2024 the group advanced ₩904.6bn into trust accounts and took ₩297.3bn back. The gross balance went from ₩224.0bn at end-FY2022 to ₩819.1bn at end-FY2024 [20] [21]. That is what a borrowing-type land trust does in a downturn: the trustee is contractually committed to fund construction, the fee is charged on pre-sale proceeds that are not arriving, and the capital stays out.
Sources: FY2025 Annual Report, allowance for credit losses on financial assets at amortised cost (FY2023–FY2025) [22]; Q1 FY2026 interim report, same table (1Q26) [23]; FY2022 Annual Report, consolidated balance sheet (FY2021–FY2022) [24].
The allowance rate is the company's own estimate of what it will not recover, expressed as a share of the gross book. It was 16.4% against a ₩224.0bn book at end-FY2022 [25]; it fell to 11.2% while the book more than doubled through FY2023 [26]; and it has since risen to 20.1% at end-FY2025 and 25.3% at the end of Q1 FY2026 [27]. Coverage was thinnest exactly while the book was being built.
The arithmetic of the loan against its own reserve is worth stating plainly. In FY2025 the trust-account book yielded ₩51.5bn of interest on an average gross balance of ₩810.9bn — a 6.3% gross yield, against separate-basis funding priced at 3.83–5.30% on bank borrowings and 5.22–6.90% on bonds [28] [29]. Over the same twelve months the allowance held against that book rose from ₩107.8bn to ₩161.2bn, an increase of ₩53.4bn [30]. The interest booked on the book was slightly less than the reserve added against it, before any funding cost.
Q1 FY2026 is the first clear evidence in the other direction. The company advanced ₩70.3bn and recovered ₩133.6bn in a single quarter, taking the gross balance down to ₩739.4bn — a net repayment of ₩63.2bn — while adding ₩25.7bn to the allowance [31] [32]. Cash is coming back and the reserve against what remains is still going up.
What reaches operating profit
Every won of operating profit can be traced to one of four blocks. The convention below charges the whole group overhead against the fee franchise, which flatters neither block: selling and administrative expense supports the lending operation too.
Source: derived from the consolidated income statement. Fee franchise = fee income less selling and administrative expense and fee expense; lending spread = interest income less interest expense and credit-loss provisions (net of reversals); investment marks = gains less losses on financial instruments; other net = other operating revenue less other operating expense. FY2023–FY2025 [33]; FY2021–FY2022 [34]. The four blocks sum to reported operating income in each year.
The fee franchise contributed ₩75.9bn of operating profit in FY2021 and ₩18.9bn in FY2025. The lending block contributed ₩61.4bn and ₩4.6bn. Neither replaced the other; both fell, for the same reason. Credit-loss provisions of ₩40.3bn, ₩76.9bn and ₩66.0bn in FY2023–FY2025 consumed most of the interest the lending book produced, and selling and administrative expense — ₩43.5bn in FY2021 and ₩42.5bn in FY2025 — barely moved against a fee line that halved [35] [36]. That is the operating leverage of this model in reverse: the cost base is a headcount that underwrites and supervises projects, and it does not scale down with the fee.
Reported net income runs above operating profit for a reason that does not repeat. FY2025 consolidated net income of ₩49.4bn included ₩32.6bn of non-operating income against ₩1.0bn the year before, of which ₩26.7bn sits in an unlabelled "other" line [37]; management attributes the increase to winning several litigation disputes [38].
Two businesses inside one balance sheet
Source: FY2025 Annual Report, management discussion, segment results [39]. Margins derived.
The listed entity contains two lenders and one fee business. The trust company itself produced ₩146.3bn of revenue and ₩9.0bn of operating income in FY2025 — a 6.2% margin. Korea Asset Capital, the wholly-owned specialist finance subsidiary, produced ₩56.7bn of revenue and ₩23.3bn of operating income, a 41.1% margin, on ₩688.0bn of assets and ₩463.5bn of its own equity [40] [41]. More than two-thirds of group operating profit in FY2025 came from the subsidiary, not the trust licence.
Q1 FY2026 sharpens that. On a separate basis — the trust company alone — operating revenue was ₩51.4bn and operating income was ₩93 million, with net income of ₩1.7bn. The consolidated group reported ₩68.8bn of revenue, ₩10.8bn of operating income and ₩12.2bn of net income over the same three months [42]. Consolidated revenue also included ₩20.1bn of gains on securities against ₩1.4bn a year earlier [43]. The trust franchise, on its own, is currently running at break-even.
How the balance sheet is funded
Source: FY2025 Annual Report, summary consolidated financial information (FY2023–FY2025) [44]; FY2022 Annual Report, consolidated balance sheet (FY2021–FY2022) [45].
The company built the trust-account book with borrowed money. On a separate basis, equity funded 81.2% of the average balance sheet in FY2022 and 64.4% in FY2025, while average bank borrowings and bonds together went from ₩127.6bn to ₩430.1bn. On the deployment side, loans rose from 20.7% of the average balance sheet to 51.4% [46] [47]. Consolidated borrowings peaked at ₩616.6bn in FY2024 and were ₩579.2bn at end-FY2025 [48].
Cash flow tracks the loan book rather than the income statement. Net operating cash flow was negative ₩246.6bn in FY2023 and negative ₩325.7bn in FY2024, then positive ₩203.3bn in FY2025 as recoveries exceeded advances [49]. For a lender this is the expected shape; it is worth noting because it is not the shape of the fee business the company describes itself as.
Asset quality is disclosed on the regulatory classification. Of ₩1,442.1bn of assets subject to classification at end-FY2025, ₩707.9bn — 49% — was substandard or below, up from 31% at end-FY2023, and ₩1,040.1bn or 72% was precautionary or below [50]. Against that, consolidated equity was ₩1,077.2bn at the end of Q1 FY2026 [51]. With 122,373,926 shares outstanding after the March 2025 cancellation [52] and a close of ₩2,325 on 7 August 2026, the market capitalisation is about ₩284bn, or 0.26 times consolidated book. The trust-account loan book alone carries at ₩552bn net of its allowance. What that gap is worth is taken up in Price Against Book.
What is being sold now
Contracted fees — the company's own order metric — were ₩124.6bn in 2022, ₩73.2bn in 2023, ₩69.9bn in 2024 and ₩98.1bn in 2025, with ₩25.1bn booked in Q1 2026 alone [53]; the product-level series is charted in History, which owns the company's dated order record. The recovery is almost entirely one product: redevelopment mandates went from ₩4bn of contracted fees in 2022 to ₩43bn in 2025, while conventional borrowing-type land trust fell from ₩38bn to ₩16bn [54]. Because land-trust fees are spread evenly across a three-to-four-year trust period [55] [56], the 2023–2024 order trough is what is being recognised as revenue now, and the 2025–2026 orders are what shows up in 2027–2029.
The scale of what those orders commit to deserves attention. In 2025 the company signed six borrowing-type land trust contracts carrying ₩59bn of contracted fees against ₩1,883bn of total project cost; in Q1 2026 it signed three more, ₩19bn of fees against ₩613bn of project cost [57]. The redevelopment pipeline behind those fees is large-complex apartment reconstruction in Seoul, Gyeonggi, Busan and Daegu, contracted with owners' unions rather than developers [58].
The strongest fact against reading that as a clean pivot is that it is the same product family under a different name. A redevelopment mandate is a land trust priced at 2.5% of pre-sale proceeds [59], and management's own description of the risk is unchanged: it commits to tighter screening and post-management of "high-risk business groups such as borrowing-type land trust" while expanding redevelopment orders in the same paragraph [60]. Whether the new book is funded by the trustee's balance sheet or by guaranteed project loans is the fact that decides whether the exposure is being rebuilt, and the filings do not break it out. Working against that concern, the guarantee book is down to five projects [61] and the largest named redevelopment sites are in Seoul and Gyeonggi [62], both set out with the 1Q26 figures in Redevelopment Pivot.
What this report is built to answer
The evidence above points to one reading: the earnings power of Korea Asset In Trust now sits in the recovery of its trust-account loan book rather than in its fee franchise, and the fee franchise as currently priced covers the group's overhead and not much more. The strongest fact against that reading is Q1 FY2026 — ₩133.6bn recovered against ₩70.3bn advanced, the first quarter of genuine net repayment, alongside a redevelopment order book that has grown tenfold in three years. What would settle it is a sequence of quarters in which the gross balance falls and the allowance rate falls with it; so far the balance is falling and the reserve against what remains keeps rising.
The rest of the report tests two things: whether the ₩739.4bn Korea Asset In Trust has advanced into its own trust accounts comes back near carrying value, and whether the redevelopment order book now replacing that business rebuilds fee earnings without rebuilding the same balance-sheet exposure.
One limitation should be stated plainly. The company holds no earnings call and publishes no transcript, so there is no management commentary anywhere in the record responding to the fee decline, the loan build or the allowance path — every statement above is filing or presentation text.
Provisions and Profit
Korea Asset In Trust's FY2025 recovery is largely an accounting rearrangement. Reported net income rose to ₩49.4bn and the return measure management leads with swung 16 percentage points, but total loss-absorbing provisions rose 3.6%, substandard-and-below assets fell 7%, and ₩254m was written off against a ₩63.7bn credit charge. The dividend was funded from share premium, not earnings.
What FY2025's profit is made of
Consolidated operating revenue fell 9.8% to ₩204.3bn and operating income fell 33.9% to ₩34.2bn, yet net income rose 32.0% to ₩49.4bn [1]. The bridge between those two directions is one line. Non-operating income was ₩32.6bn against ₩1.0bn a year earlier, and ₩26.7bn of it sits in a single "other" row [2]. The note's only explanation is a one-line footnote: the row includes ₩26.6bn of judgment principal, interest and legal costs from litigation the company won [3]. No case, counterparty or appeal status is disclosed anywhere in the filing.
Operating income (₩bn)
Credit-loss charge (₩bn)
Litigation item (₩bn)
Net income (₩bn)
Sources: FY2025 Annual Business Report, consolidated statement of comprehensive income [4] and Note 25 [5].
The litigation item does at least appear to be cash. It was not reversed as a non-cash adjustment in the indirect cash-flow reconciliation — only ₩17.7m of non-operating income was — and consolidated other receivables rose ₩5.6bn over the year [6], against operating cash flow of ₩203.3bn [7]. It is not recurring: ₩26.7bn equals 78% of the year's operating income, and no pipeline of similar claims is disclosed.
The allowance and the reserve
The measure management puts forward as the year's real result is a separate-basis adjusted return on equity of 9.51%, against reported consolidated ROE of 4.64% [8]. The definition sits on the same page: net income plus the reversal of the regulatory credit-loss reserve (or minus its appropriation), divided by average equity from which that same reserve has been deducted. The reserve therefore lifts the numerator and shrinks the denominator in a year it is released, and does the reverse in a year it is built.
That reserve is not a profit-and-loss item. Under the Financial Investment Business Regulation the company must appropriate out of retained earnings whatever amount its IFRS allowance falls short of the supervisory minimum [9]. It is the gap between two provisioning standards, not a second layer of protection on top of the first. When the IFRS allowance rises, the required reserve falls by roughly the same amount, and the pot of money standing against bad assets barely moves.
That is what happened. Between end-FY2024 and end-FY2025 the IFRS allowance rose ₩63.8bn, from ₩151.9bn to ₩215.7bn, while the regulatory reserve fell ₩52.2bn, from ₩169.8bn to ₩117.6bn. Total provisions rose ₩11.6bn, or 3.6% [10]. The swap repeated in the first quarter of 2026: allowance up ₩27.0bn, reserve down ₩18.1bn, total up ₩8.9bn [11].
Sources: FY2022 Annual Business Report, asset soundness status [12]; FY2025 Annual Business Report, asset soundness status [13]; 1Q 2026 investor presentation [14].
Because the reserve movement drives the adjusted profit figure, that figure swings far harder than the business does. Reported consolidated net income has ranged between ₩37.4bn and ₩129.6bn over five years; the reserve-adjusted number has ranged between minus ₩46.4bn and plus ₩119.6bn. In FY2024 the group appropriated ₩83.8bn to the reserve and posted an adjusted loss; in FY2025 it reversed ₩52.2bn of that and posted adjusted profit of ₩101.6bn — its highest in three years, on the lowest operating income in the series.
Sources: credit-loss reserve notes — FY2022 Annual Business Report [15], FY2023 [16], FY2024 [17], FY2025 [18].
Summed across the five years, reported net income is ₩432.2bn and reserve-adjusted profit is ₩336.2bn. The ₩96.0bn difference is the net amount the reserve grew over the period, from ₩21.6bn at end-2020 [19] to ₩117.6bn at end-2025 — the cumulative shortfall of IFRS provisioning against the supervisory formula. As a five-year series, the adjusted return averages about 5.4% across FY2021–FY2025: 13.01%, 9.57%, 1.35%, minus 6.55%, 9.51% [20] [21]. For a business whose collateral is a property cycle, the multi-year average is the more useful anchor, and it sits close to what the one broker still covering the stock assumes: a September 2025 note values the shares at 0.35 times forward book on an implied 5.1% return on equity, and no research has been published on the company since [22].
What the underlying sites did
The classification data says the sites themselves barely moved. Assets classified substandard or below fell from ₩763.0bn to ₩707.9bn — down 7.2% — and still account for 49% of all assets subject to classification, against 31% two years earlier [23]. At 31 March 2026 the substandard-and-below balance was ₩711bn, marginally above the year-end figure, though the normal-grade balance rose 14% in the quarter [24].
Source: 1Q 2026 investor presentation, asset quality condition [25].
Underneath the totals, one thing did change materially, and it cuts in the company's favour. Loan receivables assessed individually for impairment — the credit-impaired population — rose from ₩147.5bn to ₩416.8bn, a 2.8-fold increase, with the substandard grade's individually assessed balance standing at ₩285.0bn against ₩45.6bn a year earlier [26] [27]. Individual assessment discounts each site's own expected recovery rather than applying a portfolio loss rate, and it is the stricter treatment. The allowance rate on the trust-account loan book followed: 13.16% at end-FY2024, 20.09% at end-FY2025 [28], and 25.28% at 31 March 2026 [29].
Provisions against write-offs
An allowance is an estimate until something is written off. Over three years the group charged ₩174.3bn of credit losses against loan receivables and wrote off ₩19.4bn — 11% of what it provided. FY2025 is the extreme case: a ₩63.7bn charge and ₩254m of write-offs, a ratio of 0.4% [30].
Two other lines point the same way. Interest recognised on assets already deemed credit-impaired — booked into income but drawn out of the allowance rather than collected — rose from ₩0.6bn in FY2023 to ₩1.6bn and then ₩3.3bn [31]. And group-wide, interest received in cash has run below interest recognised for three consecutive years — by ₩32.4bn, ₩11.6bn and ₩16.0bn, ₩60.0bn cumulatively [32] [33]. The filings do not split how much of that gap is interest capitalised into trust-account balances rather than genuinely uncollected, so the gap bounds the question without settling it.
Sources: FY2025 Annual Business Report, movement in allowance for credit losses on loan receivables [34] consolidated statement of cash flows [35] and consolidated statement of comprehensive income [36]; write-off percentages derived.
The auditor has named the same estimate a key audit matter in each of the last three years — expected credit loss on loan receivables, alongside occurrence and period attribution of land-trust fees — while issuing an unqualified opinion each time [37]. The following page records that the engagement passes from Han Young to Samjong for FY2026 to FY2028 under the periodic-designation rule [38]. A new firm inheriting a three-year-old key audit matter is a dated, checkable event; its first full-year opinion lands in March 2027.
What paid the dividend
The FY2025 dividend rose 50% to ₩150 per share, or ₩18.4bn, against separate-basis net income of ₩25.4bn — a payout ratio of 72.26%, the second consecutive year above 70% [39].
The same page shows where the money came from, and the company states it directly. Two entries fed distributable retained earnings during the year that had nothing to do with trading: a ₩60.0bn transfer of share premium into retained earnings [40], and a ₩45.3bn release of the credit-loss reserve appropriated a year earlier. The footnote to the appropriation statement says the cash dividend is to be paid out of that transferred capital reserve, under Article 461-2 of the Commercial Act [41]. The mechanism is ordinary and lawful in Korea, and the ₩60bn sat inside shareholders' equity before the transfer as it does after. What it means for a reader is that the dividend increase carries no information about earning power, and that both additions to distributable profit were one-time.
Where the evidence lands
The read here is that FY2025's improvement is mostly presentation. Operating income fell by a third; the profit increase came from a litigation award; the return measure improved because a reserve was released rather than because sites recovered; and the dividend was funded from share premium. On the underlying asset question the year was roughly neutral to modestly better — a 7% reduction in substandard-and-below balances and a genuinely stricter allowance basis, but with almost nothing written off to test either.
The strongest fact against that read sits in the first quarter of 2026. The trust-account loan book fell from ₩802.6bn to ₩739.4bn, and the cash-flow reconciliation shows ₩63.2bn of net recovery from it in three months [42] [43] — the first period in this corpus where the book returned cash at scale rather than absorbing it. Recoveries sustained at that pace would settle the recoverability question faster than any provisioning debate.
Against that, the credit charge has not eased. Management wrote in March 2026 that because expected losses on major sites had already been conservatively reflected across 2024 and 2025, the additional credit-cost burden should ease gradually [44]. The quarter that followed carried a ₩32.3bn charge, 3.6 times the year-ago quarter and above every quarter of 2025 [45]. The fourth quarter of 2025, inside the year that produced the 9.51% figure, was itself an operating loss of ₩5.6bn and a net loss of ₩5.2bn [46].
Sources: quarterly investor presentations, operating expense detail — 1Q 2025 [47], 2Q 2025 [48], 3Q 2025 [49], FY2025 [50], 1Q 2026 [51].
Three observable things would move this read. If substandard-and-below balances fall materially below ₩600bn while the trust-account allowance rate holds near 25%, provisioning is being validated by outcomes rather than reshuffled. If write-offs return to double-digit billions without the classified balance falling, the FY2025 allowance was too thin. And if the regulatory reserve keeps unwinding while total provisions stay flat, the adjusted return will keep improving with nothing underneath it changing. Each is disclosed quarterly, in the asset-soundness table and the allowance schedule.
The multiple the market has already applied to that record is taken up in Price Against Book. The dated chronicle of how the company arrived here is in History; the mechanics of the loan book itself are in Business.
Two credit books, one cycle
Korea Asset In Trust consolidates two lenders to Korean property development, not one. The parent's trust-account advances stood at ₩739.4bn gross at 31 March 2026 against a 25.28% allowance [1]. Korea Asset Capital's loan book stood at ₩612.9bn gross against 6.33% [2]. The subsidiary holds 43% of consolidated equity and produced 63% of first-quarter profit [3] [4]. No tab in this report has examined it.
Sources: gross balances from the consolidated loan note in the FY2025 annual report [5] [6], the FY2024 annual report [7], the FY2023 annual report [8], and the Q1 FY2026 report [9] [10].
The books are comparable in size and have moved in opposite directions. Since end-2023 the trust-account book has grown 58% and its allowance rate has more than doubled; the capital arm's book is 3% smaller than it was two years ago and its allowance rate has risen from 3.39% to 6.33% [11] [12]. In the March 2026 quarter the divergence was direct: the trust-account book fell ₩63.2bn while the capital arm's grew ₩29.1bn.
Source: derived from the gross balances and allowances disclosed in the same consolidated loan notes [13] [14] [15] [16] [17] [18].
A four-times gap in provisioning between two books lent against the same asset class needs a reason, and part of one exists. The trust-account advance is the trustee's own money put into a project it manages, funding cost overruns on units that have not sold. Korea Asset Capital lends project finance and bridge loans against collateral, and management describes its FY2025 posture as selective new origination with the emphasis on recovering existing bridge loans [19]. Different seniority can justify different reserves.
What the reason does not cover is the subsidiary's own supervisory return. Under the capital-company soundness rules, Korea Asset Capital classified ₩71.8bn of credit — 12.08% — as substandard or worse at end-2025, after ₩95.3bn and 14.36% at end-2024 and ₩60m and 0.01% at end-2023 [20]. The ₩37.9bn allowance the group carries against that book equals 53% of the balance the subsidiary itself calls non-performing. In the year the classified balance jumped ₩95.3bn, the allowance rose ₩8.3bn.
The bracket that follows is arithmetic rather than a forecast. Covering the subsidiary's own ₩71.8bn of classified credit in full would take about ₩34bn of additional allowance, 3.1% of consolidated equity. Applying the parent's 25.28% rate to the whole ₩612.9bn book would take about ₩116bn, 10.8% of the ₩1,077.2bn of consolidated equity [21]. The lower end is close to a mechanical consequence of the subsidiary's own classification; the upper end assumes the two books rank equally, which the collateral structure argues against.
The pricing evidence sits on the other side of that argument. The capital arm's loans have consistently earned more than the trust-account advances: ₩49.2bn of loan interest on an average gross book of ₩626.3bn in FY2025, a 7.9% yield, against ₩51.5bn on an average ₩810.9bn of trust-account balances, 6.3% [22]. The book with the higher contracted return carries the lower reserve. Both readings can be true at once — better collateral and better pricing — but they pull in opposite directions, and the filings disclose no vintage, loan-to-value or expected-recovery detail for the subsidiary that would settle it.
What the capital arm earns on the capital it holds
Korea Asset Capital is wholly owned, was founded in 2012 [23], and has been recapitalised three times: ₩40bn in 2020, ₩100bn in 2021 and a further ₩50bn in 2022, taking the parent's cost of investment from ₩60.4bn to ₩250.4bn [24] [25] [26]. That carrying value has not moved since [27].
Sources: summarised subsidiary financial information in the FY2021 [28], FY2022 [29], FY2023 [30], FY2024 [31] and FY2025 [32] annual reports; equity is assets less liabilities as disclosed, and the return is net income over average equity, derived.
Equity has compounded from ₩172.1bn to ₩463.5bn in five years and the return on it has halved twice: 10.2% in FY2022, 10.5% in FY2023, 6.0% in FY2024, 4.6% in FY2025 [33] [34]. Revenue peaked in FY2023 at ₩90.0bn and has fallen 37% since. The March 2026 quarter ran at ₩7.65bn of net income on ₩471.2bn of equity, an annualised 6.5% [35].
Three facts frame what that capital is doing. The subsidiary's regulatory capital ratio was 65% against a 7% minimum for licensed capital companies, up from 55% in each of the two prior years [36] — it is running at roughly a ninth of the leverage its licence permits, and the ratio rose because the book shrank faster than the equity. Its three-month liquidity ratio fell from 244% to 216% to 139% over the same three years [37]. And in FY2025 the only transaction recorded between parent and subsidiary was ₩56.6m of trademark royalty [38] — no dividend has been paid up. Cumulative net income of ₩166.4bn over FY2020 to FY2025 has stayed inside the subsidiary while the group raised its borrowings to ₩579.2bn at an average 5.47% [39].
The counter to reading that as trapped capital is that the two entities run identical leverage — the parent's separate balance sheet is ₩1,288.0bn on ₩867.2bn of equity, the subsidiary's ₩688.0bn on ₩463.5bn, both 1.48 times [40] — so pulling money out of one and into the other changes where the equity sits, not how much the group has. What it would change is the answer to a narrower question: whether ₩463.5bn is what the subsidiary's net assets are worth. On the evidence above, that answer is most sensitive to the ₩38.8bn allowance: the bracket set out above — a further ₩34bn to ₩116bn of provisioning — is 7% to 25% of the subsidiary's ₩463.5bn of equity.
The related-party loan sits inside the capital arm
₩56.9bn of the subsidiary's loan book is lent to MDM Plus, the controlling family's unlisted development company, against an allowance of ₩190m — 0.33%, against 6.50% for the book as a whole [41]. The balance was ₩51.0bn a year earlier and took a fresh ₩6.0bn advance during FY2025 [42]. A ₩10.0bn loan to The M Retail, an MDM joint venture, was repaid in full in the same year [43]. None of this appears in the parent's separate related-party note [44]; the lending to the controller's affiliates runs through the subsidiary. Control of the group and its economics are set out in People.
The scale argument runs the other way, and it is the stronger of the two. MDM Plus reported ₩3,361.6bn of assets and ₩1,719.2bn of equity for 2025 on the company's own group disclosure — larger than Korea Asset In Trust itself [45]. The affiliates also guarantee part of the group's contract-deposit lending to unit buyers, a flow the related-party ledger in People sets out [46]. A near-zero reserve against a borrower of that size is defensible on credit grounds. It remains the one loan the filings break out in a ₩583.8bn book, and the filings disclose no rate, maturity or security for it.
The securities book is smaller than it looks
The third block of the balance sheet is ₩238.1bn of financial assets at fair value through profit or loss, 70.5% of it level 3 — ₩112.9bn of beneficiary certificates and ₩49.3bn of partnership interests valued on net asset value, discounted earnings at rates of 4.72% to 20.33%, or original cost [47] [48]. That composition invites the assumption that reported profit rests on unverifiable marks. The roll-forward does not support it.
Level 3 assets fell from ₩213.7bn to ₩167.9bn during FY2025. The movement was ₩11.3bn of purchases, ₩32.6bn of sales, ₩17.2bn transferred out, and a valuation loss of ₩7.3bn [49]. The level-3 book shrank mostly by being sold, and its marks cost the group money rather than making it. A one-percentage-point move in the unobservable inputs shifts the remaining ₩147.5bn of level-3 fair value by about ₩2.4bn either way [50] [51].
Sources: gains and losses on financial instruments from the consolidated income statements in the FY2025 annual report [52], the FY2023 annual report [53] and the Q1 FY2026 report [54]; distribution and dividend income from other operating income notes [55] [56] [57].
Netted properly, the portfolio has been a modest contributor, not a swing factor. Gains of ₩24.3bn in FY2025 came with losses of ₩14.8bn, for ₩9.5bn net; FY2024's ₩13.2bn of gains came with ₩22.6bn of losses, for minus ₩9.3bn [58]. Adding distribution and dividend income, the three years FY2023 to FY2025 produced about ₩38.9bn on an average portfolio near ₩249bn, roughly 5.2% a year — below the 5.47% the group paid on its borrowings in FY2025 [59].
The exception is the quarter just reported, and it deserves stating plainly rather than smoothing. In 1Q FY2026 the portfolio produced ₩20.1bn of gains against ₩6.6bn of losses — ₩13.5bn net, more than the ₩10.8bn of consolidated operating income and the ₩12.2bn of net income recorded in the same three months [60]. Roughly ₩9.7bn of the gain was realised on disposal rather than marked [61], which is the part that reduces the concern; the composition of the book has also shifted, with listed equities rising from ₩14.4bn to ₩43.3bn during FY2025 as ₩20.5bn was invested in 35 quoted names [62] [63]. A trust company in the middle of a workout added a quoted equity book; that is a use of capital worth watching in its own right.
What would move the read
The judgment here is that the group's book value question is wider than the trust accounts the report has examined so far (Provisions and Profit), and that the capital subsidiary is the part of it the filings describe least. Three observable things would settle the direction, and all three are disclosed quarterly.
The subsidiary's non-performing balance and its allowance moving together. A classified balance falling toward the ₩38.8bn already reserved would confirm the current rate; the balance holding near ₩70bn while the allowance stays put would not.
Whether the capital arm's book keeps growing. It added ₩29.1bn in the March quarter after management said new origination would be selective. Growth funded by the ₩94.7bn of undrawn commitments the group already carries would raise the exposure without a new decision being visible.
Any dividend from the subsidiary to the parent. Six years of retained profit and a 65% capital ratio against a 7% minimum make one possible; its absence has been the consistent pattern since 2020.
The undrawn commitment figure is the ₩94,652,547 thousand of unused loan agreements the group reported at 31 December 2025 [64].
Against this read stands the simplest counter-fact available: almost none of either book's provisioning has yet been tested by an actual loss — ₩253.8m of loans were written off in FY2025 against a ₩206.8bn allowance [65] — and the subsidiary has never reported a loss-making year in the six covered here [66] [67]. What would change the read in the other direction is the subsidiary's allowance rate converging on the parent's without the classified balance falling — the pattern that would say the two books were always the same risk.
Funding the Advances
In FY2025 Korea Asset In Trust's trust-account loan book produced ₩51.5bn of interest income and absorbed a ₩53.4bn increase in its own allowance, while the group's interest expense for the year was ₩39.7bn against ₩34.2bn of operating income — a funding bill incurred on the ₩258.1bn of borrowings the parent raised in 2024, the year the same advance book grew from ₩469bn to ₩819bn and parent cash fell to ₩2.4bn. Trust-account interest was ₩51,451,952 thousand for the year [1]; the allowance carried against those advances rose from ₩107.8bn to ₩161.2bn [2]; consolidated interest expense was ₩39.7bn [3] against operating income of ₩34.2bn [4]; the parent's borrowings went from ₩100.0bn to ₩358.1bn during 2024 while its cash closed the year at ₩2.4bn [5]; and the advance book moved from ₩469bn to ₩819bn over the same twelve months [6].
The debt behind the book is short — ₩390.3bn of the ₩579.2bn outstanding at the end of 2025 falls due during 2026 — and part of it is secured on the advances themselves. Covenants and regulatory ratios are nowhere near binding; price and rollover are the live constraints.
Group borrowings, 31 Mar 2026 (₩bn)
Share maturing during 2026
Committed lines undrawn (₩bn)
FY2025 interest expense (₩bn)
Sources: borrowings at 31 March 2026 from the Q1 FY2026 report [7]; maturity profile and totals from the FY2025 annual report [8]; committed facilities from the FY2025 annual report [9]; interest expense from the 1Q FY2026 results deck [10].
Does the advance book cover the money that funds it?
The ₩53.4bn is not a payment and not a write-off. It is the company's own restatement, made at each year end, of how much of the advance book it still expects to collect, and it is set against a revenue line that is largely accrued rather than received (Provisions and Profit). What matters in this chapter is the sign rather than the size: on the trust-account book alone, FY2025's interest did not cover the year's addition to the allowance held against it.
Netted, the FY2025 combination on that book is minus ₩1.9bn before any funding cost — ₩51.5bn of interest [11] against an allowance that went from ₩107.8bn to ₩161.2bn [12]. On 122,373,926 shares [13] that is ₩16 a share, 0.2% of the ₩8,803 of book value per share at 31 March 2026 and the same 0.2% of the ₩1,077.2bn of consolidated equity behind it [14]. Add the group's ₩39.7bn interest bill [15] — a group-wide figure rather than an allocation to the advance book, though the parent has no other borrowing purpose of comparable size — and the combination is ₩41.7bn, ₩341 a share, 3.9% of book value per share and the same 3.9% of consolidated equity. One further year on the FY2025 terms takes book value per share from ₩8,803 to about ₩8,462, and two years to ₩8,121, or 7.7% of the book value the price is quoted against (Price Against Book).
Three cited facts cut against reading FY2025 as the run rate, and they belong beside the finding rather than after it. Read at group level the sign flips: the capital arm's loan book produced ₩49.2bn of interest [16] against an allowance build of ₩8.2bn, from ₩29.7bn to ₩37.9bn [17], so group lending revenue of ₩100.7bn exceeded the combined ₩61.6bn build across both books by ₩39.1bn. Almost none of the provisioning has been realised as loss — write-offs against loan receivables were ₩253.8m in FY2025 against a ₩63.7bn charge, 0.4% [18]. And the March 2026 quarter ran the other way: ₩133.6bn recovered against ₩70.3bn advanced, a net ₩63.2bn repayment in three months [19].
Where the funding came from
Through 2022 and 2023 the trust company carried almost no debt of its own. Separate-basis borrowings were ₩100.0bn at the end of 2022 and ₩100.0bn at the end of 2023, against cash of ₩121.7bn and ₩79.0bn respectively [20] [21]. Over those same two years the trust-account advance book rose from ₩224bn to ₩469bn [22]. That growth came out of retained earnings and the cash pile.
2024 is where the funding model changes. The advance book went from ₩469bn to ₩819bn, and the parent's borrowings went from ₩100.0bn to ₩358.1bn — ₩258.1bn raised in twelve months — while its cash fell to ₩2.4bn [23] [24]. At group level the same year took borrowings from ₩330.0bn to ₩616.6bn and net debt from ₩215.1bn to ₩595.6bn [25] [26].
Sources: advances from the 1Q FY2026 results deck [27] [28]; group and parent borrowings from the FY2024 and FY2025 annual reports [29] [30] [31] and the Q1 FY2026 report [32].
The average contract rate on that debt moved with the cycle rather than with the company: 3.37% in 2021, 4.97% in 2022, 5.87% in 2023, 5.78% in 2024 and 5.47% in 2025 [33] [34]. The company borrowed most heavily in the two years the rate was highest.
What the funding costs
What the borrowing has changed is the income statement. Consolidated interest expense was ₩15.1bn in 2022, ₩19.5bn in 2023, ₩28.6bn in 2024 and ₩39.7bn in 2025 [35] [36]. This issuer charges interest within operating expenses, so operating income is struck after it: over the same four years operating income fell from ₩146.9bn to ₩34.2bn.
Source: results presentations, consolidated income statement [37] [38].
Two qualifications on that interest line. The first is arithmetic: ₩39.7bn on average borrowings of ₩598bn implies 6.6%, above the 5.47% average contract rate the company discloses; the filings do not reconcile the two, and the gap plausibly holds lease interest, discount amortisation and the capital arm's own funding, none of which is broken out.
The second is more useful. Interest expense is a cash cost and interest income largely is not. In 2025 the group recognised ₩110.3bn of interest income and received ₩94.3bn in cash, while recognising ₩39.7bn of interest expense and paying ₩35.6bn [39] [40]. Across 2023-2025 the group recognised ₩325.4bn of interest income and collected ₩265.4bn, a ₩60.0bn shortfall; on the paying side it recognised ₩87.8bn and paid ₩84.9bn, a ₩2.9bn shortfall [41] [42]. The spread is booked on both sides; only one side settles in cash on schedule.
Price is also where the credit rating lands. The April 2024 public bonds were sold at 6.80% and 6.90%; the February 2025 pair at 5.22% and 5.62% [43]. Korea Ratings cut the grade one notch to A- with a stable outlook on 2 May 2026, citing poor collection of trust-account advances and the drag of interest and credit costs on recurring profitability — a Korean-press report dated after the last filing in this corpus, and not verifiable inside it (Price Against Book). Whether the April and August 2026 maturities were refinanced, and at what coupon, is the first observable test of what that notch costs; neither event falls inside the filings read here.
What falls due
At 31 December 2025, ₩390.3bn of the ₩579.2bn of group borrowings matured during 2026 — 67% of the stack inside twelve months. The shape is not new: a year earlier, ₩400.3bn of ₩616.6bn was scheduled to mature during 2025 [44] [45].
Source: FY2025 annual report, maturity schedule of borrowings [46].
During 2025 the group drew ₩387.8bn of new borrowings and issued ₩170.6bn of bonds, while repaying ₩514.5bn of borrowings and ₩84.0bn of bonds — ₩558.4bn raised and ₩598.5bn repaid against a year-end stack of ₩579.2bn [47]. The group refinances close to its entire debt load every year.
The asset it funds does not work on that clock. The company's own liquidity disclosure states the basis: for trust-account advances on projects that have already pre-sold, liquidity is calculated from the contractual instalment and completion payments; for unsold projects, the advance is treated as recovered only when the trust business terminates — and substandard-and-below assets are excluded from liquid assets altogether [48]. Applying that basis, the parent's own cumulative coverage of liabilities by assets inside three years was 268% at the end of 2023, 82% at the end of 2024 and 86% at the end of 2025 [49] [50]. Two consecutive years below 100% on the company's own measure is the maturity mismatch stated in its own numbers, and it is the reason the funding question is separable from the recovery question that runs through the rest of this report.
What is pledged
Part of the 2024 borrowing was not plain unsecured debt. At the end of that year ₩160bn of face value sat in three facilities named for special-purpose vehicles — KIS KAIT No.1 Dasi 1st (₩70bn, maturing 20 August 2025), No.1 Dasi 2nd (₩30bn, same date) and No.2 Dasi 1st (₩60bn, maturing 20 January 2026) — carried at ₩158.3bn after present-value discount [51]. Against those facilities the group assigned, as security, its statutory claim under Article 46 of the Trust Act to be reimbursed by the trust estate for trust-administration costs [52].
That claim is the legal form of the trust-account advance itself. The security taken by the lenders is the same receivable whose recoverability is a central open question in this company's accounts (Provisions and Profit). At end-2024 the pledged funding was 25.7% of group borrowings.
By the end of 2025 the structure had been consolidated into one facility: KIS KAIT No.3, ₩100bn at 5.30%, maturing 3 August 2026, again secured by assignment of the trust cost-reimbursement claims over specified land-trust projects [53] [54]. It was still outstanding, unchanged, at 31 March 2026 [55]. Pledged funding is now 17.1% of group borrowings. The technique is not an innovation of the downturn — the 2016 IPO prospectus records the same pledge of cost-reimbursement claims over two trust sites in support of a project-specific facility [56] — but the scale is.
Alongside the secured facilities, the parent replaced short paper with term bonds during 2025. Public bonds rose from ₩99.8bn to ₩199.7bn while other borrowings fell from ₩258.3bn to ₩164.3bn [57]. Three commercial-paper facilities of ₩10bn each, drawn at end-2024, are gone from the 2025 note [58].
What is not stretched
The constraints a stressed borrower runs into first are all a long way off. The four outstanding public bonds carry maintenance covenants, and the FY2025 compliance table shows the headroom.
Source: FY2025 annual report, bond management agreement terms and compliance [59].
A fourth covenant restricts a change in the largest shareholder; MDM's holding has not moved (People), and the table records compliance [60]. The security-granted figure of 9.33% of equity is about ₩101bn on consolidated equity of ₩1,083.3bn [61], which is the KIS KAIT No.3 facility. The pledge covenant and the secured facility describe the same thing, and the covenant permits roughly thirty times as much.
The regulatory ratios sit in the same place. The net operating capital ratio was 284% at end-2024, 363% at end-2025 and 364% at 31 March 2026 [62], against a 150% minimum for a category-3 investment business [63]. And the committed bank facilities have gone from being used to being reserve capacity: ₩194.0bn of limits with ₩28.0bn drawn at end-2023, ₩264.0bn with ₩70.0bn drawn at end-2024, and ₩154.0bn with nothing drawn at end-2025 and again at 31 March 2026 [64] [65] [66] [67]. Eleven facilities across nine banks make up those limits; ₩143.0bn of the ₩154.0bn sits at the trust company rather than the capital arm [68].
Set against the two large named maturities of 2026 — the ₩54bn public bond due 29 April [69] and the ₩100bn secured facility due 3 August — the group held ₩153.8bn of cash at 31 March 2026 plus ₩154.0bn of undrawn committed lines [70] [71]. Twice the cover for those two, though not for the full ₩390.3bn 2026 schedule, which requires the bank book to keep rolling.
Where the first quarter points
The March 2026 quarter recovered ₩63.2bn net from the trust-account book, taking it from ₩802.6bn to ₩739.4bn [72] [73]. None of it went to debt. Group borrowings rose slightly, from ₩579.2bn to ₩581.5bn; cash rose from ₩109.5bn to ₩153.8bn, and the parent's own cash from ₩32.7bn to ₩99.2bn [74]. Recoveries were parked, not applied — consistent with pre-funding the April bond and the August facility rather than with deleveraging.
The three-month regulatory liquidity ratio records the same thing from the other direction. It was 909% at the end of 2025 and 197% at 31 March 2026, because three-month liabilities rose from ₩24.2bn to ₩125.2bn as the April maturities entered the window while liquid assets rose only to ₩246.6bn [75]. The 100% floor is still cleared by a wide margin, but the ratio is volatile by construction and reads as a maturity calendar rather than as a condition.
Sources: FY2024 and FY2025 annual reports [76] [77]; Q1 FY2026 report [78]. The capital arm's three-month ratio is not published for 1Q26.
The one measure that has moved consistently in one direction belongs to the capital subsidiary: 284%, 244%, 216% and 139% across 2022 to 2025, against the same 100% floor [79] [80]. Its ₩78.3bn of three-month liabilities is small in group terms, and its regulatory capital ratio is 63% against a 7% requirement [81] — but it is the entity that supplied most of group operating profit in 2025 (Where Book Value Sits), and it funds itself separately.
Reading it, and what would change it
On the disclosed record this is a cost-and-rollover exposure rather than a solvency one. Covenant headroom is measured in multiples, the capital ratios clear their floors by a factor of two or more, the committed lines are undrawn, and the group holds cash and facilities together worth twice the two named maturities of 2026. What has actually happened is that a trust company carrying ₩100.0bn of debt at the end of 2023 took on ₩264bn more within two years to fund advances that recover on construction timetables, and the group's interest bill of ₩39.7bn in 2025 now sits ahead of the ₩34.2bn of operating profit left after it.
The strongest fact against the benign read is the company's own three-year liquidity coverage: 82% and 86% in the last two years, on a basis that already assumes unsold projects repay only at trust termination and excludes substandard assets entirely [82]. Two-thirds of the debt turns over annually against an asset that does not, which makes continued bank and bond-market access a condition of the recovery thesis rather than an assumption behind it — and the rating moved a notch the wrong way in May 2026.
Three things would settle it, each checkable in a specific filing:
The refinancing of the ₩100bn secured facility maturing 3 August 2026 — whether it is replaced, at what rate, and whether the replacement again takes assignment of cost-reimbursement claims. The borrowings note in the Q3 FY2026 quarterly report carries all three.
The average contract rate disclosed in the FY2026 annual report's funding section. It fell from 5.87% to 5.47% across three years of easing policy rates; a rise against a falling policy rate would isolate the cost of the downgrade.
The committed-facility note. ₩154.0bn of limits with nothing drawn is the group's reserve; a fall in the limits, or a drawn balance reappearing, would be the first sign that the reserve is being consumed rather than held. The same note carries whether new borrowing-type origination — which draws on this balance sheet as well as on the risk ceiling (Redevelopment Pivot) — is being funded from cash or from lines.
Redevelopment Pivot
Korea Asset In Trust's fee franchise contributed ₩75.9bn of operating profit in FY2021 and ₩18.9bn in FY2025, and the 2025 order vintage rebuilding it carried ₩59bn of contracted borrowing-type fees against ₩1,883bn of total project cost — 3.1% against 7.4% on the 2024 vintage, because redevelopment is priced at 2.5% of pre-sale proceeds against 3.5% conventional — while at 31 March 2026 the group's entire guarantee and completion-obligation book was four redevelopment sites with ₩183.3bn of limits and ₩67.4bn drawn. [1] [2] [3] [4] [5]
That first pair of figures is not the segment result and not net profit. It is the fee business on its own: fee income less the fee expense and the selling and administrative expense that produce it — ₩119.5bn less ₩0.1bn less ₩43.5bn in 2021, and ₩63.2bn less ₩1.8bn less ₩42.5bn in 2025. The cost side barely moved. The revenue side halved, and the ₩75.9bn became ₩18.9bn.
What the order book buys per unit of project
The company's own order metric — new fee commitments, or 수주액 — is the sum of fee entitlements on contracts signed in the year, collected under internal rules and recognised as operating revenue over time [6]. For borrowing-type land trust the presentation pack pairs those fees with the total project cost of the contracts they came from, and the two series have moved apart.
Source: 1Q 2026 Investor Presentation (15 May 2026), Trust business — loan-type land trust orders; ratios derived from the disclosed contracted fees and total project cost [7].
Six contracts signed in 2025 carried ₩59bn of fees against ₩1,883bn of project cost. Three signed in the first quarter of 2026 carried ₩19bn against ₩613bn. In 2024, three contracts produced ₩43bn of fees on ₩580bn of cost, and in 2022 six produced ₩41bn on ₩498bn [8]. Fee intensity fell from roughly 8% of project cost to 3%, and it fell in one step, between the 2024 and 2025 vintages.
Two disclosed mechanics account for the step, and both point the same way. The posted rate on a redevelopment mandate is 2.5% of pre-sale proceeds against 3.5% for conventional borrowing-type land trust [9]. And in a redevelopment scheme most of the finished homes are not sold at all: the disclosed pipeline rebuilds 19,800 existing households as 33,081, so about 40% of the delivered units are new stock available for public pre-sale, the rest going to the union members who already own there — the deck's own process chart separates "property sale (union member)" from "property pre-sales (public)" [10]. A rate one-third lower applied to a base roughly 40% of the project produces about a third of the fee intensity, which is what the ratio shows. The filings never disclose what the fee base is on a redevelopment mandate, so this is the arithmetic that fits the observed ratio rather than a disclosed reconciliation.
Two facts confirm that the redevelopment work is being booked inside the borrowing-type product line rather than beside it. The annual reports give new fee commitments for borrowing-type land trust of ₩115.6bn in 2021, ₩41.5bn in 2022, ₩27.8bn in 2023, ₩43.2bn in 2024 and ₩58.5bn in 2025 [11] [12] [13] [14] [15]. Those figures match the presentation's conventional-plus-redevelopment totals in each of the four years the deck covers — 42, 27, 43 and 59 [16]. Redevelopment is not an adjacent, lighter product in the company's own accounting; it is the same line that produced the trust-account loan book examined in Business.
What the repricing costs the fee line
Applying the 3.1% intensity to the ₩1,883bn of 2025 project cost gives ₩58.4bn of contracted fee, and to the ₩613bn signed in the first quarter of 2026, ₩19.0bn — which is what the order table discloses, so the ratio and the source agree. Land-trust fees are spread evenly across the whole trust period as a single performance obligation [17], and the company puts that period at three to four years [18]. On that clock, the ₩78bn of fee those fifteen months of signings carry converts to ₩19.5bn to ₩26.0bn of fee revenue a year.
Consolidated fee income averaged ₩110.7bn across 2022, 2023 and 2024 [19] [20], so the gap the new vintages leave is ₩85bn to ₩91bn a year. Against the ₩1,077.2bn of consolidated equity at 31 March 2026 [21] that is 7.9% to 8.5% of book value a year of foregone fee revenue — ₩692 to ₩745 a share against the ₩8,803 book value per share used in Price Against Book — and 2.5 to 2.7 times the ₩34.2bn of operating income the group earned in FY2025 [22]. Part of that gap is basis rather than repricing: the two vintages are borrowing-type land trust only, while the ₩110.7bn is every fee the group earns. Scaling the whole order book instead, as the next section does, lands nearer ₩63bn.
The trust period on a redevelopment mandate is nowhere disclosed. Three to four years is the company's statement about trust order intake in general, not about schemes that must clear union authorisation, demolition, construction and pre-sale; a seven-year clock puts the same ₩78bn at ₩11.1bn a year and widens the gap to ₩99.6bn, or 9.2% of book value. ₩11bn to ₩26bn a year of fee revenue from fifteen months of signings is the bound the disclosure supports, and the spread inside it is not a hedge — it is the single assumption that moves the answer most.
Where the completion obligation sits now
The company discloses each year the payment guarantees and completion obligations it carries on trust projects, split into three lines: redevelopment land trusts where it has given the Korea Housing and Urban Guarantee Corporation a joint undertaking on union members' relocation loans; redevelopment land trusts where HUG guarantees the project-cost loan and, under HUG's standard project agreement, the trustee as project executor carries the completion obligation; and completion-guarantee land trusts, where the trustee steps in if the contractor fails and compensates the lenders if it cannot [23]. The aggregate unwind of that book is recorded in Industry; its composition is what has changed.
Sources: FY2022 and FY2023 columns from the FY2023 consolidated contingency note [24]; FY2024 from the FY2024 note [25]; FY2025 from the FY2025 off-balance-sheet section [26]; 1Q 2026 from the Q1 FY2026 consolidated contingency note [27].
At the end of 2022 the completion-guarantee line was the larger half of the book: 18 sites and ₩600.5bn drawn, against four HUG-route redevelopment sites at ₩505.2bn [28]. By the end of 2025 one completion-guarantee site remained, with a ₩64.0bn limit and ₩60.0bn drawn; the annual report states that its contractor's completion deadline was April 2026 and that the site had obtained use approval by the filing date [29].
Sites with an obligation
Guarantee limit (₩bn)
Lender debt drawn (₩bn)
Redevelopment share
Source: Q1 FY2026 Quarterly Report, Note 27 Contingencies and commitments, at 31 March 2026 [30].
At 31 March 2026 the completion-guarantee line is gone from the table. What remains is four redevelopment sites — two on the relocation-loan undertaking at a ₩33.3bn limit and ₩11.2bn drawn, two on the HUG project-cost route at a ₩150.0bn limit and ₩56.2bn drawn — and the note says so directly: apart from redevelopment projects, there are no sites on which the group bears a completion obligation [31]. The redevelopment mandates are not a fee-only product held at arm's length from the balance sheet. On the HUG-guaranteed route the trustee is the party that must finish the building, and the obligation is disclosed and not provisioned: the filings state each year that the loss cannot be measured reliably and so no amount is recognised, with progress monitored site by site [32] [33].
Three facts cut the other way, and they are on the same pages. Project cost is not the fee base — the fee is struck on projected pre-sale proceeds, and the 2025 vintage's cost base more than tripled from ₩580bn to ₩1,883bn, which moves the ratio further than the rate card does [34]. The obligation book shrank rather than grew: four HUG-route sites with ₩898.2bn of limits and ₩505.2bn drawn at the end of 2022, against two sites with ₩150.0bn and ₩56.2bn drawn at 31 March 2026 [35] [36], so the 100% redevelopment share is residual — the remainder of a book that was retired, not a book that was rebuilt. And the largest named schemes are in Seoul and Gyeonggi [37], while the loss experience management describes is concentrated in the non-capital region, where the share of unsold homes stayed high [38].
What the fee line can be
Trust order intake is recognised as operating revenue over three to four years, on the company's own statement [39], and that makes the intake series a usable, if rough, forward gauge of the fee line.
Sources: new fee commitments from the FY2021–FY2025 annual reports [40] [41]; consolidated fee income from the FY2025 and FY2023 consolidated income statements [42] [43].
The three years of intake that fed 2022–2024 revenue totalled ₩424.2bn. The three years that feed 2026–2028 — 2023, 2024 and 2025 — total ₩241.2bn, 43% less. Scaling the earlier relationship gives a fee line of roughly ₩63bn a year through 2028, which is where 2025 already sits (₩63.2bn). On the order book as signed, the fee franchise looks flat rather than recovering, and it takes a sustained step up in intake — the ₩25.1bn booked in the first quarter of 2026 annualises to about ₩100bn [44] — to move it.
Three qualifications matter to that estimate, and they are not symmetric. The scaling assumes redevelopment mandates convert on the same three-to-four-year clock as conventional work, which the filings nowhere confirm; a longer trust period spreads the same fee thinner per year. Contracted fees are struck on projected pre-sale proceeds, so a mandate whose units do not sell never delivers its full entitlement — the same variable that drives the trust-account loan book's recovery drives the fee. And the auditor has named the occurrence and period attribution of land-trust fees a key audit matter in each of FY2023, FY2024 and FY2025 [45]. Each of the three points to the low side of ₩63bn rather than the high.
The ceiling that now governs new work
A new prudential limit sits between the pipeline and the balance sheet. The Financial Services Commission amended the Financial Investment Business Regulation to cap a trust company's total expected risk from land trust business against its own equity, phased in: not more than 150% to 30 December 2026, not more than 120% from 31 December 2026 to 30 December 2027, and thereafter within equity [46]. The regulator adopted the amendment on 25 June 2025 with effect from 1 July 2025, and in the same package widened the net operating capital regime so that a trust company bearing a completion obligation must carry a credit risk charge regardless of which land trust type the obligation arises under.
Separate-basis equity was ₩867.2bn at the end of 2025 [47], so the ceiling is roughly ₩1,301bn of expected risk today, ₩1,041bn from the end of 2026 and ₩867bn from the end of 2027. Set against that, the six contracts signed in 2025 alone carried ₩1,883bn of total project cost, and three more in the first quarter of 2026 carried ₩613bn [48]. Expected risk is a computed supervisory figure and not project cost, so those numbers do not net against each other — but the scale relationship is the reason the rule was written, and it is the constraint on how much new borrowing-type work the company can sign.
Two features of the regime cut in opposite directions, and both are visible in what the company has been contracting. Under the same amendment, a HUG-guaranteed loan on a trust-format redevelopment scheme is carved out of both the net operating capital ratio and the land-trust risk ceiling where it meets the conditions — chiefly that the trustee's liability for the borrowing is limited to the trust estate, so it is not recognised as proprietary-account debt. The HUG route is therefore the one structure that lets the company put a large project through without consuming capped risk capacity, and it is also the structure whose standard agreement places the completion obligation on the trustee [49]. Capacity and contingent liability move in opposite directions on the same contract.
What a reader cannot do is measure the headroom. The company discloses the net operating capital ratio — 363.04% at end-2025, on operating net capital of ₩391.5bn against total risk of ₩107.8bn [50] — but not the land-trust expected-risk figure the new ceiling is struck against, which is a different computation. The ratio that would bind new origination is not published.
What the pipeline is, and when
The disclosed redevelopment pipeline is 22 named schemes, six on the trust-agency structure and sixteen on the trust-operator structure, rebuilding 19,800 existing households as 33,081 [51]. Its distribution across the statutory stages is what governs timing, because the fee base — pre-sale proceeds — only arrives at demolition and construction.
Source: 1Q 2026 Investor Presentation, Procedures and structure of reconstruction business; stage grouping derived from the per-project rows [52]. The printed project rows sum to 33,119 planned homes against a stated total of 33,081, a 0.1% difference in the source.
Three schemes have completed construction. Three more have management-and-disposal-plan authorisation, the stage immediately before demolition. Thirteen of the 22 — roughly 25,000 of the 33,081 planned homes — sit at trustee designation or reserve-trustee selection, several steps and typically several years short of the public pre-sale that generates the fee [53]. The pipeline is large and early. Management describes it in the same terms, calling redevelopment order activity a source of medium-to-long-term growth while saying that 2026 profitability may vary as the restructuring phase runs its course [54].
Where the evidence lands
On the record above, the redevelopment pivot is real business on a slower and thinner engine than the order-intake line suggests: a fee line that scales to about ₩63bn a year through 2028 on intake already signed, and a pipeline mostly several stages short of the pre-sale that pays it. The exposure it re-attaches is documented rather than hypothetical — the HUG-guaranteed structure makes the trustee the party that must complete the building, and at 31 March 2026 that structure accounts for every completion obligation the group carries. Management's claim that it cleared completion risk ahead of the sector is supported by the run-off series [55].
Three observables would move this read. The count and drawn balance on the HUG-route line in each quarterly contingency note: if it climbs back through ₩200bn as the pipeline reaches construction, the obligation is being rebuilt at scale rather than run off. The fee-intensity ratio on new borrowing-type contracts: a return toward 5% or better would say the company is winning mandates on terms closer to its posted card rather than volume at a discount to it. And disclosure of the land-trust expected-risk ratio itself, which would convert the ceiling from an unmeasurable constraint into a testable one. Absent that last item, the company's capacity to write the business it is describing cannot be verified from the filings.
Price Against Book
Korea Asset In Trust's shares closed at ₩2,325 on 7 August 2026, valuing the equity at ₩284.5bn against ₩1,077.2bn of consolidated book value — 0.26 times book, on a book value per share that has risen 27% in won since December 2021 while the price fell 44%. This chapter converts that multiple into the two things it can arithmetically mean, tests both against the disclosed record and against the only listed peer, and prices what the wait pays.
Market capitalisation (₩bn)
Price / book
Dividend yield on ₩150
Implied loss on gross credit
Sources: close, market capitalisation and yield from the coverage record [1]; consolidated equity at 31 March 2026 from the Q1 FY2026 report [2]; implied loss derived from the two loan books at 31 March 2026 [3] [4].
Book value rose while the price halved
The share count has been effectively fixed for the whole period: 123,977,752 shares issued from 2021 through 2024, of which 1,603,826 were held in treasury and cancelled in March 2025, leaving 122,373,926 outstanding throughout [5]. Book value per share is therefore a clean series. Consolidated equity was ₩849.3bn at the end of 2021 and ₩932.4bn at the end of 2022 [6], ₩1,035.0bn, ₩1,045.8bn and ₩1,083.3bn at the ends of 2023, 2024 and 2025 [7], and ₩1,077.2bn at 31 March 2026 after the year-end dividend was struck [8].
The price series comes from the exchange data reprinted in each annual report. December closing prices ranged ₩4,040–4,330 in 2021 [9], ₩2,985–3,375 in 2022 [10], ₩3,160–3,310 in 2023 [11], ₩2,785–2,940 in 2024 [12] and ₩2,430–2,555 in 2025 [13].
Sources: December closing-price ranges from the annual reports [14] [15] [16] [17] [18], taken at the midpoint of the monthly high and low; book value per share derived from consolidated equity [19] [20] [21] over 122,373,926 shares [22].
Source: derived from the price and equity citations above.
The compression is continuous rather than a single re-rating event. Every year since 2021 the multiple has been lower than the year before, and in four of those five years reported book value per share was higher than the year before. The two figures that make up the ratio have moved in opposite directions for five consecutive years.
Two arithmetics behind one multiple
A 0.26 multiple can be arrived at from either end. Read as a statement about assets, it is a claim that the balance sheet carries more value than it will realise. Read as a statement about returns, it is the multiple a business earns when its sustainable return sits below its cost of capital, whatever the assets are worth.
The asset reading comes first. At 31 March 2026 the group held ₩739.4bn of gross trust-account advances against a ₩186.9bn allowance [23] — a 25.28% rate [24] — and ₩612.9bn of loans at Korea Asset Capital against a ₩38.8bn allowance, carried net at ₩571.7bn [25]. That is ₩1,352.3bn of gross property-development credit, ₩225.8bn already provisioned (16.7%), ₩1,124.2bn carried. The gap between the ₩1,077.2bn of book value and the ₩284.5bn of market value is ₩792.7bn.
The balance that would take that loss carries a funding cost of its own. In FY2025 Korea Asset In Trust's trust-account loan book produced ₩51.5bn of interest income and absorbed a ₩53.4bn increase in its own allowance, while the group's interest expense for the year was ₩39.7bn against ₩34.2bn of operating income — a funding bill incurred on the ₩258.1bn of borrowings the parent raised in 2024, the year the same advance book grew from ₩469bn to ₩819bn and parent cash fell to ₩2.4bn. [26] [27] [28] [29] [30] [31] The funding record behind it sits in Funding the Advances.
If every other asset and liability is carried correctly, closing that gap out of the credit books alone takes a further 70.5% loss on what is left after existing provisions — a cumulative ultimate loss of ₩1,018.4bn, or 75.3% of the gross book. Recognising tax relief on those provisions would make the required pre-tax loss larger still, not smaller.
Now the returns reading. On a zero-growth residual-income identity, price to book equals sustainable return on equity divided by cost of equity. At a 10% cost of equity, 0.26 times book corresponds to a permanent 2.6% return; at 12%, to 3.2%. The company's own disclosure puts consolidated return on average equity at 4.64% in 2025 [32], and its results deck runs the series back to 2021 for a five-year average of 9.4% [33]. Management's own adjusted measure, which strips the regulatory reserve movement out, averages roughly 5.4% over the same five years [34], as Provisions and Profit works through.
Source: derived from the disclosed return-on-equity series [35] [36] applied to book value per share of ₩8,803 at 31 March 2026 [37]; zero terminal growth assumed throughout.
The grid applies return assumptions with no forward-earnings anchor, and the fee line is where that anchor has to come from. Korea Asset In Trust's fee franchise contributed ₩75.9bn of operating profit in FY2021 and ₩18.9bn in FY2025, and the 2025 order vintage rebuilding it carried ₩59bn of contracted borrowing-type fees against ₩1,883bn of total project cost — 3.1% against 7.4% on the 2024 vintage, because redevelopment is priced at 2.5% of pre-sale proceeds against 3.5% conventional — while at 31 March 2026 the group's entire guarantee and completion-obligation book was four redevelopment sites with ₩183.3bn of limits and ₩67.4bn drawn. [38] [39] [40] [41] [42] On that intake, Redevelopment Pivot scales the fee line to roughly ₩63bn a year through 2028, against ₩110.7bn of consolidated fee income averaged over 2022 to 2024; whether the 5.4% row of the grid is reachable turns on that line rather than on the cost-of-equity assumption beside it.
The two readings are not alternatives to be chosen between; the discount is the product of both. But their sizes are very different. A 5.4% through-cycle return at a 10% cost of equity justifies roughly half the current discount on its own, with no asset-quality claim attached. What is left over — the move from about 0.54 times book to 0.26 — is the part that has to be an opinion about recovery on the loan books, and that residual still implies losses outside the observed record: ₩174.3bn of provisions charged against ₩19.4bn actually written off across FY2023–FY2025, as Provisions and Profit documents, and ₩63.2bn of net recovery on the trust-account book in the March 2026 quarter [43].
On earnings the same shares are not expensive on any basis in the record.
Sources: reported net income by year from the FY2025 results deck [44]; the FY2026 estimate and the ₩284.5bn market capitalisation from the coverage record [45].
The single broker still covering the stock published a ₩3,100 target on 30 September 2025 and has not refreshed it; the target is 12-month forward book value per share of ₩8,996 times 0.35, struck on an implied 5.1% return on equity [46]. That is a valuation built the same way as the middle row of the grid above, and it lands 33% above the current price.
The same discount at the only listed peer
The residual attributed above to Korea Asset In Trust's own loan books is not priced into this company alone. Korea Real Estate Investment and Trust — the only other listed pure-play Korean trust company, and the peer the Competition tab adjudicates as the sole like-for-like comparable — closed at ₩1,202 on 15 January 2026, the day it announced the disposal of 14,880,952 treasury shares. Its consolidated equity attributable to owners was ₩1,038.3bn at the end of 2025 [47] on 252,489,230 shares issued [48] less 34,080,105 held in treasury [49]. That is ₩4,753 of book value per outstanding share, and 0.25 times book at that price — 0.27 once the disposed treasury shares are counted back in.
The comparison cuts against a purely company-specific reading of the discount, and it does so from the weaker side. Korea Real Estate Investment and Trust reported an operating loss of ₩20.9bn on ₩184.4bn of operating revenue in 2025, against Korea Asset In Trust's ₩34.2bn of operating profit on ₩204.3bn [50] [51]. Two firms with materially different 2025 income statements carry within two or three points of the same multiple of book. That pattern is more consistent with a sector-level de-rating of Korean trust-company balance sheets than with a market judgment about one company's loan tape — which also means a re-rating on this name is unlikely to arrive from company-specific evidence alone.
The peer price and the January 2026 treasury disposal are both single dated items from outside the filing corpus and are not verifiable in it; the equity, share and treasury figures behind the multiple are from the peer's own annual report.
A stress the disclosures can carry
The useful test of the asset reading is what the filings themselves would support if read against the company. Two adjustments can be made entirely from disclosed numbers.
Source: derived from the gross balances and allowances on both loan books at 31 March 2026 [52] [53] and consolidated equity [54]; no tax relief assumed.
Marking Korea Asset Capital's ₩612.9bn at the parent's own 25.28% rate takes its allowance from ₩38.8bn to ₩154.9bn, the ₩116.1bn harmonisation charge Where Book Value Sits derives. Lifting the trust-account allowance from 25.28% to 40% adds ₩108.8bn. Together, ₩225.0bn — 20.9% of book — leaving ₩852.2bn of equity and ₩6,964 of book value per share. At ₩2,325 that is still 0.33 times a stressed book. A further 20% haircut on the ₩167.9bn of level-3 fair-value holdings set out there would add about ₩34bn and move the multiple to 0.35.
Eliminating the equity entirely from the current provisioning position requires ₩1,077.2bn of further loss, which with existing allowances is a cumulative 96% loss on the whole ₩1,352.3bn credit book. The group's borrowings were ₩581.5bn against that equity and it held ₩153.8bn of cash and deposits at 31 March 2026 [55], and the net operating capital ratio stood at 363.04% [56] against the 150% the investment-business regulation requires [57]. What a holder is underwriting here is a range of book values rather than a solvency question.
The debt market's version
The same balance sheet is rated, and the rating record is the closest thing to a third-party read on the loan books; the grades, the February 2025 placement and the maturity ladder behind them are set out in Funding the Advances. In April 2025 Korea Ratings and NICE both cut the outlook from stable to negative, citing operating profit falling from ₩146.8bn in 2022 to ₩51bn in 2024 [58].
On 2 May 2026 Korea Ratings cut the grade one notch to A- with a stable outlook, attributing the action to poor collection of trust-account advances and to interest and credit costs eroding recurring profitability. That action post-dates the last filing in this corpus — the Q1 FY2026 rating table still ends at 8 April 2025 — so it is sourced from the Korean financial press rather than from a filing, and it is reported here as such. Agencies that see the loan tapes have moved once, and the ₩128.0bn of bonds falling due within a year of 31 December 2025 has to be refinanced at whatever the new grade prices [59].
What the wait pays
The dividend has been paid without a break since 2015, as History records. The FY2025 declaration was ₩150 per share, ₩18.4bn in total, a 37.17% consolidated payout and a 5.7% yield on the reference price [60]. The five-year average disclosed yield is 5.6% [61]. On the 7 August 2026 close of ₩2,325 the same ₩150 is a 6.45% yield [62].
Source: dividend indicators table, FY2025 annual report [63].
Alongside it, the company cancelled 1,603,826 treasury shares on 26 March 2025 at a book value of ₩12,561,688,800 [64], 1.3% of the shares then issued, and describes the cancellation in its dividend policy as part of shareholder return [65]. That is the entire buyback record; no treasury holding remains beyond 6,871 fractional shares [66].
Part of that payment came out of paid-in capital rather than out of profit. Consolidated capital surplus fell from ₩130.8bn at the end of 2024 to ₩70.8bn at the end of 2025 and stood unchanged at ₩70.8bn at 31 March 2026 [67] — the ₩60bn of share premium moved into distributable retained earnings to fund the FY2025 dividend, which Provisions and Profit traces to the appropriation statement. At the FY2025 rate of ₩18.4bn a year, what remains of that reservoir is close to four more payments if separate-basis profit never covers the dividend again. It is a real cushion and a finite one, and it converts paid-in capital into income rather than generating it.
The float
At 31 March 2026, 25,879 small shareholders held 53,729,807 shares, 43.91% of the 122,373,926 outstanding [68]; the rest sits with MDM, MDM Plus and Moon Ju-hyun, whose holdings the People tab shows have not changed in five years. At ₩2,325 that free float is worth ₩124.9bn. Over the 80 sessions to 7 August 2026 the median day traded ₩551m of stock and the average day ₩910m [69].
Twice in the past year that float has behaved very differently. In February 2026 the stock traded 22,606,437 shares in the month, including 11,816,948 in one session, and ranged ₩2,585 to ₩3,025 [70] — 42% of the entire small-shareholder holding changing hands in four weeks, against a monthly norm nearer 3.6m shares. On 4 June 2026 the shares reached ₩2,850 intraday on 9,946,912 shares and closed the day at ₩2,210; the low close in the window was ₩2,065 on 26 June 2026 [71].
The control-bloc record, including the 2026 change to the related-persons table that the press reported as a sale, is set out in People [72]. At a quarter of book, no member of the control bloc and no director has bought a share in the open market.
What would move the read
The read this chapter lands on: the discount is wider than the company's returns alone justify, and the residual — the part that is an asset-quality claim — requires ultimate losses on the two credit books of a size the provisioning and recovery record has not yet produced, while a stress well beyond anything recognised still leaves book value at roughly three times the current price. Two facts sit against it. The rating agencies looking at the same loans moved the outlook to negative in April 2025 and cut the grade in May 2026, with ₩128.0bn of bonds to refinance within a year. And the only listed peer trades at the same multiple with a worse income statement, which locates much of the discount in the sector rather than in this balance sheet, and makes a re-rating dependent on more than this company's own disclosures. Four things would decide it, all checkable on a date:
The statement of appropriation in the FY2026 annual report, due March 2027, will show whether the dividend again required a transfer out of the remaining ₩70.8bn of share premium, or whether separate-basis profit covered it.
The trust-account balance and allowance rate in each quarterly report: the March 2026 quarter combined a ₩63.2bn fall in the gross book [73] with a rise in the allowance rate to 25.28% [74]. That combination continuing is the workout converging; the gross balance turning up again, or the rate rising on a flat balance, is not.
Any first dividend from Korea Asset Capital to the parent, or a second treasury cancellation. The subsidiary holds ₩463.5bn of equity and has never paid one, as Where Book Value Sits records; capital moving up would be the first evidence that the group intends to convert surplus regulatory capital into shareholder return rather than into more lending.
The next rating action. The grade has held investment-grade throughout the workout; a move below A- would change both the funding cost on the ₩316.0bn bond stock and the evidential weight of the credit market's opinion, which is currently the main check on the reading above.
On a ten-year view the corpus supports less. The five-year adjusted-ROE average of about 5.4% is the only through-cycle anchor in the record; at a 10% cost of equity it justifies about 0.54 times book, ₩4,754 a share, and at 12% about 0.45 times, ₩3,961. What sits behind that anchor is structural rather than financial: History covers twenty-five years of a business assembled in 2001 and 2002 out of the land-trust portfolios of two failed predecessors, and Industry identifies the same mechanism running across the sector — a fee business that stands behind other parties' performance, so a downturn cuts fee volume while raising the exposure the trustee carries. What the corpus does not contain is ten-year evidence on this company as a listed one: it has been listed since July 2016 and has run a single property cycle since. The three-to-five-year question can be bounded from the record above; the ten-year one cannot be settled from it.
The numbers behind Korea Asset In Trust Co., Ltd.: as-reported financial statements and company metrics for FY2021–FY2025, traced to the source filings, opened with the share-price history those statements have to justify. Every linked figure opens the exact page of the filing it was printed on, with the statement row highlighted. Amounts in KRW millions unless noted.
Reading notes: All figures are the consolidated (연결) numbers for Korea Asset In Trust and its subsidiaries, principally Korea Asset Capital (한국자산캐피탈). The filings print every statement in whole won. Values here are converted to millions of won, so component rows can differ from a printed subtotal by up to one million; no sum-check blocks are attached for that reason. The citation anchor is always the figure exactly as printed in won. FY2021 and FY2022 are cited to the FY2023 annual business report rather than to their own reports. The FY2023 report restated both comparative years into the current line-item taxonomy (금융상품평가및처분이익, 신용손실충당금 전입액/환입액), and the balance-sheet page of the FY2022 report did not extract. Totals are unchanged in every case. FY2019 and FY2020 in the Long-Term Record are the comparative columns of the FY2021 annual business report; FY2016-FY2018 come from the standardized data feed and carry no page links. Total equity is not available for FY2016-FY2018.
Share Price — Available History Since April 2026
The stock closed at ₩2,325 on Aug 07, 2026 — down 12% over the window shown, trading between ₩2,065 and ₩2,765. At that close the stock trades at 5.8× FY2025 diluted EPS as reported below.
Source: market price feed, daily closes, Apr 2026–Aug 2026 — the feed marks this available history as partial. Price return only, excludes dividends.
Market capitalization ₩284.5bn.
Market cap = 122.4M shares outstanding × the Aug 07, 2026 close of ₩2,325. Market-derived, shown without filing links.
FY2025 at a Glance
Revenue (KRW millions)
Operating income (KRW millions)
Net income (KRW millions)
Diluted EPS
Source: FY2025 consolidated statements [1] [2]. Click any linked figure to open the filing page with the row highlighted.
Operating Revenue by Source
| Operating Revenue by Source | FY2021 | FY2022 | FY2023 | FY2024 | FY2025 |
|---|---|---|---|---|---|
| Fee and commission income (수수료수익) | 119,494 | 127,935 | 115,438 | 88,735 | 63,248 |
| Gain on valuation and disposal of financial instruments (금융상품평가및처분이익) | 15,419 | 9,019 | 20,514 | 13,207 | 24,323 |
| Interest income (이자수익) | 62,331 | 82,527 | 104,188 | 110,874 | 110,331 |
| Reversal of allowance for credit losses (신용손실충당금 환입액) | 11,494 | 4 | — | — | — |
| Other operating income (기타영업수익) | 3,789 | 13,479 | 18,931 | 13,631 | 6,386 |
| Total operating revenue (영업수익) | 212,527 | 232,965 | 259,072 | 226,448 | 204,288 |
| Total operating revenue (영업수익) growth, derived | — | +9.6% | +11.2% | -12.6% | -9.8% |
Source: Consolidated Statement of Comprehensive Income (연결 포괄손익계산서), operating revenue section. FY2021 and FY2022 are the reclassified comparative columns of the FY2023 annual business report. [1] [2]. Click any linked figure to open the filing page with the row highlighted.
Income Statement
Source: Consolidated Statement of Comprehensive Income (연결 포괄손익계산서) [1] [2]. Click any linked figure to open the filing page with the row highlighted.
Columns marked E are consensus analyst estimates from analyst consensus, shown alongside reported results for direct comparison; they are not company guidance.
Estimate source: analyst consensus (claude_web), as of 2026-08-09. Forecasts carry no filing page links.
Balance Sheet
Source: Consolidated Statement of Financial Position (연결 재무상태표) [3] [4]. Click any linked figure to open the filing page with the row highlighted.
Cash Flow
Source: Consolidated Statement of Cash Flows (연결 현금흐름표) [5] [6]. Click any linked figure to open the filing page with the row highlighted.
Fee and Commission Income by Trust Type
| Fee and Commission Income by Trust Type | FY2021 | FY2022 | FY2023 | FY2024 | FY2025 |
|---|---|---|---|---|---|
| Land development trust (토지신탁) | 77,085 | 92,858 | 92,024 | 67,475 | 41,355 |
| Management trust (관리신탁) | 94 | 275 | 54 | 70 | 11 |
| Disposal trust (처분신탁) | 32 | 102 | 60 | 37 | 22 |
| Collateral trust (담보신탁) | 5,262 | 4,794 | 1,980 | 4,693 | 6,177 |
| Pre-sale management trust (분양관리신탁) | 1,081 | 1,068 | 1,242 | 1,210 | 906 |
| Trust fees, subtotal (신탁보수 합계) | 83,554 | 99,097 | 95,359 | 73,485 | 48,471 |
| Agency service fees (대리사무) | 7,119 | 11,405 | 9,894 | 6,886 | 6,595 |
| Other fees (기타) | 28,822 | 17,432 | 10,185 | 8,364 | 8,183 |
| Total fee and commission income (수수료수익) | 119,495 | 127,934 | 115,438 | 88,735 | 63,248 |
Source: II. Business — Results by Business Type (영업의 종류별 실적). FY2023-FY2025 printed in thousands of won in the FY2025 report; FY2021-FY2022 printed in millions of won in the FY2023 report. [7] [8] [9]. Click any linked figure to open the filing page with the row highlighted.
New Trust Mandates (수주) and Land-Trust Pipeline
| New Trust Mandates (수주) and Land-Trust Pipeline | FY2021 | FY2022 | FY2023 | FY2024 | FY2025 |
|---|---|---|---|---|---|
| New fee agreements signed (신규 수수료 약정액, 수주액) | 226,400 | 124,600 | 73,200 | 69,900 | 98,100 |
| — of which loan-type land trust (차입형토지신탁) | 115,600 | 41,500 | 27,800 | 43,200 | 58,500 |
| New loan-type land trust contracts signed (건) | 11 | 6 | 3 | 3 | 5 |
| Total project cost of those contracts (총사업비) | 2,122,000 | 498,000 | 247,000 | 580,000 | 1,883,000 |
| Loan-type land trust assets under management (차입형토지신탁 수탁고) | 2,500,000 | 2,500,000 | 2,400,000 | 2,300,000 | 2,200,000 |
| REITs AMC service fee (리츠 AMC 보수) | 10,506 | 3,424 | 3,166 | 3,368 | 4,081 |
Source: company filings [10] [11] [12] [13]. Click any linked figure to open the filing page with the row highlighted.
Trust Account Lending (신탁계정대)
| Trust Account Lending (신탁계정대) | FY2021 | FY2022 | FY2023 | FY2024 | FY2025 |
|---|---|---|---|---|---|
| Trust account loans outstanding, gross (신탁계정대 기말잔액) | 261,465 | 223,963 | 468,808 | 819,119 | 802,592 |
| Interest income on trust account loans (신탁계정대이자) | 23,497 | 12,671 | 24,959 | 44,982 | 51,452 |
| Interest income on loans to customers (대출금이자) | 32,379 | 57,952 | 68,131 | 59,539 | 49,201 |
Source: company filings [14] [15] [16] [17]. Click any linked figure to open the filing page with the row highlighted.
Asset Soundness (자산건전성)
| Asset Soundness (자산건전성) | FY2021 | FY2022 | FY2023 | FY2024 | FY2025 |
|---|---|---|---|---|---|
| Assets subject to soundness classification (건전성 분류대상 자산) | 780,002 | 849,742 | 1,148,214 | 1,539,312 | 1,442,111 |
| Precautionary-and-below assets (요주의이하자산) | 262,657 | 248,144 | 588,979 | 1,104,723 | 1,040,102 |
| Precautionary-and-below ratio (요주의이하자산비율) | 33.67% | 29.20% | 51.30% | 72.00% | 72.00% |
| Substandard-and-below assets (고정이하자산) | 57,550 | 79,501 | 353,865 | 763,026 | 707,937 |
| Substandard-and-below ratio (고정이하자산비율) | 7.38% | 9.36% | 30.82% | 50.00% | 49.00% |
| Allowance plus credit-loss reserve (충당금설정액) | 54,892 | 58,110 | 167,462 | 321,679 | 333,294 |
| Coverage ratio, allowance plus equity over precautionary-and-below (커버리지비율) | 344.23% | 399.18% | 204.17% | 124.00% | 136.00% |
Source: company filings [18] [19]. Click any linked figure to open the filing page with the row highlighted.
Capital Adequacy and Liquidity (재무건전성)
| Capital Adequacy and Liquidity (재무건전성) | FY2021 | FY2022 | FY2023 | FY2024 | FY2025 |
|---|---|---|---|---|---|
| Net operating capital, parent (영업용순자본) | 478,346 | 526,678 | 462,444 | 324,160 | 391,472 |
| Won liquidity ratio, parent (원화유동성비율) | 825.53% | 840.89% | 422.64% | 264.00% | 909.00% |
| KAIC adjusted equity capital ratio (한국자산캐피탈 조정자기자본비율) | 58.30% | 52.33% | 54.65% | 55.00% | 65.00% |
| KAIC non-performing loan ratio (한국자산캐피탈 무수익여신비율) | 0.01% | 0.01% | 0.01% | 14.36% | 12.08% |
Source: company filings [20] [21] [22] [23]. Click any linked figure to open the filing page with the row highlighted.
Shareholder Returns and Market Position
| Shareholder Returns and Market Position | FY2021 | FY2022 | FY2023 | FY2024 | FY2025 |
|---|---|---|---|---|---|
| Cash dividend per common share (주당 현금배당금) | 220.00 | 220.00 | 220.00 | 100.00 | 150.00 |
| Consolidated cash payout ratio (연결 현금배당성향) | 25.05% | 24.87% | 20.77% | 32.70% | 37.17% |
| Cash dividend yield, common shares (현금배당수익률) | 5.2% | 6.7% | 6.8% | 3.6% | 5.7% |
| Share of industry operating revenue, 14 trust companies (영업수익 시장점유율) | 10.0% | 10.0% | 13.0% | 10.0% | 9.0% |
| Employees at year end (직원 수) | 191 | 203 | 201 | 173 | 149 |
Source: company filings [24] [25] [12] [26]. Click any linked figure to open the filing page with the row highlighted.
Long-Term Record
| Fiscal year | Total operating revenue (영업수익) | Operating profit (영업이익) | Profit for the year (당기순이익) | Basic earnings per share (기본주당이익) | Net cash flows from operating activities (영업활동순현금흐름) | Total equity (자본총계) |
|---|---|---|---|---|---|---|
| FY2016 | 136,478 | 96,186 | 73,167 | 920 | (102,357) | — |
| FY2017 | 222,485 | 166,803 | 126,725 | 1,350 | (118,312) | — |
| FY2018 | 226,571 | 137,872 | 103,392 | 1,012 | (168,618) | — |
| FY2019 | 223,264 | 114,071 | 88,753 | 725 | (90,158) | 661,107 |
| FY2020 | 240,062 | 178,672 | 130,008 | 1,062 | 569,276 | 768,871 |
| FY2021 | 212,527 | 147,926 | 107,461 | 878 | (62,753) | 849,261 |
| FY2022 | 232,965 | 146,870 | 108,242 | 885 | (5,439) | 932,433 |
| FY2023 | 259,072 | 116,706 | 129,642 | 1,059 | (246,591) | 1,035,048 |
| FY2024 | 226,448 | 51,765 | 37,424 | 306 | (325,727) | 1,045,754 |
| FY2025 | 204,288 | 34,227 | 49,382 | 404 | 203,263 | 1,083,326 |
Source: consolidated statements across filings; older years from the standardized feed [5] [1] [3] [6]. Click any linked figure to open the filing page with the row highlighted.
Operating KPIs
| KPI | FY2021 | FY2022 | FY2023 | FY2024 | FY2025 |
|---|---|---|---|---|---|
| Trust assets under management (수탁고, 신탁원본 기준) | 19,441,492 | 21,150,559 | 18,707,430 | 19,480,214 | 22,630,207 |
| Net operating capital ratio, NCR (영업용순자본비율) | 516.7% | 510.9% | 370.0% | 284.0% | 363.0% |
Source: company-reported operating metrics [21] [7] [23] [9]. Click any linked figure to open the filing page with the row highlighted.
Analyst Consensus
Mean target
Street ratings: Effectively no live consensus. Only one broker covers Korea Asset In Trust (Hanwha Investment Securities, analyst Song Yu-rim): Buy, target KRW 3,100, published 2025-09-30 and not refreshed since. Buy/Hold/Sell = 1/0/0. FnGuide (WiseReport) as of 2026-08-07 explicitly reports no investment opinion issued within the last 3 months and leaves the 2026/12(E) consensus column blank; Naver Finance returns 추정EPS/추정PER = N/A with an empty research list; Hankyung Consensus returns zero reports for all of 2026. Note the discrepancy: Investing.com displays a mean 12-month target of KRW 3,600 (high 3,600 / low 3,600, 1 analyst, Buy), but that figure matches no dated broker report found on Korean sources and appears stale, so the verified KRW 3,100 from the primary PDF is reported here. Stock last closed at KRW 2,325 (2026-08-07), implying ~33% upside to the 3,100 target.
Estimate source: analyst consensus (claude_web), as of 2026-08-09. Forecasts carry no filing page links.
Traceability
553 of 568 figures on this page (97%) link to the filing page where they are printed — click a linked figure to open the source PDF at that page with the row highlighted. Unlinked figures come from standardized data feeds or pre-filing years.
All figures are the consolidated (연결) numbers for Korea Asset In Trust and its subsidiaries, principally Korea Asset Capital (한국자산캐피탈).
The filings print every statement in whole won. Values here are converted to millions of won, so component rows can differ from a printed subtotal by up to one million; no sum-check blocks are attached for that reason. The citation anchor is always the figure exactly as printed in won.
FY2021 and FY2022 are cited to the FY2023 annual business report rather than to their own reports. The FY2023 report restated both comparative years into the current line-item taxonomy (금융상품평가및처분이익, 신용손실충당금 전입액/환입액), and the balance-sheet page of the FY2022 report did not extract. Totals are unchanged in every case.
FY2019 and FY2020 in the Long-Term Record are the comparative columns of the FY2021 annual business report; FY2016-FY2018 come from the standardized data feed and carry no page links. Total equity is not available for FY2016-FY2018.
Earnings per share is stated in won per share as printed. Basic and diluted are identical in every year: the company reports no dilutive instruments.
Korean quarterly reports print a three-month column for Q1, Q2 and Q3 but never a discrete fourth quarter, and print cash flows on a year-to-date basis only. Q4 FY25 income-statement figures and all Q2-Q4 cash-flow figures are therefore exact differences of two printed cumulative figures and are marked as derived.
The data feed for this run has no balance_sheet.json, so balance-sheet rows are taken entirely from the filings with no independent cross-check.
8 figure(s) differed between the data feed and the filing; the filing value is shown (see the run's metrics/metrics_tab.json for the audit trail).
Korea Asset In Trust Co., Ltd.'s management explains the business in its own materials. The slides below do the most of that work, pulled from the documents preserved in Sources. Each source link opens the complete presentation at that slide in a new tab.
Earnings Release for 1Q 2026 — 1Q 2026
The current edition of KAIT's only investor deck: trust and REIT operations, the earnings decline, and where it sits inside MDM group. · Open the full document →
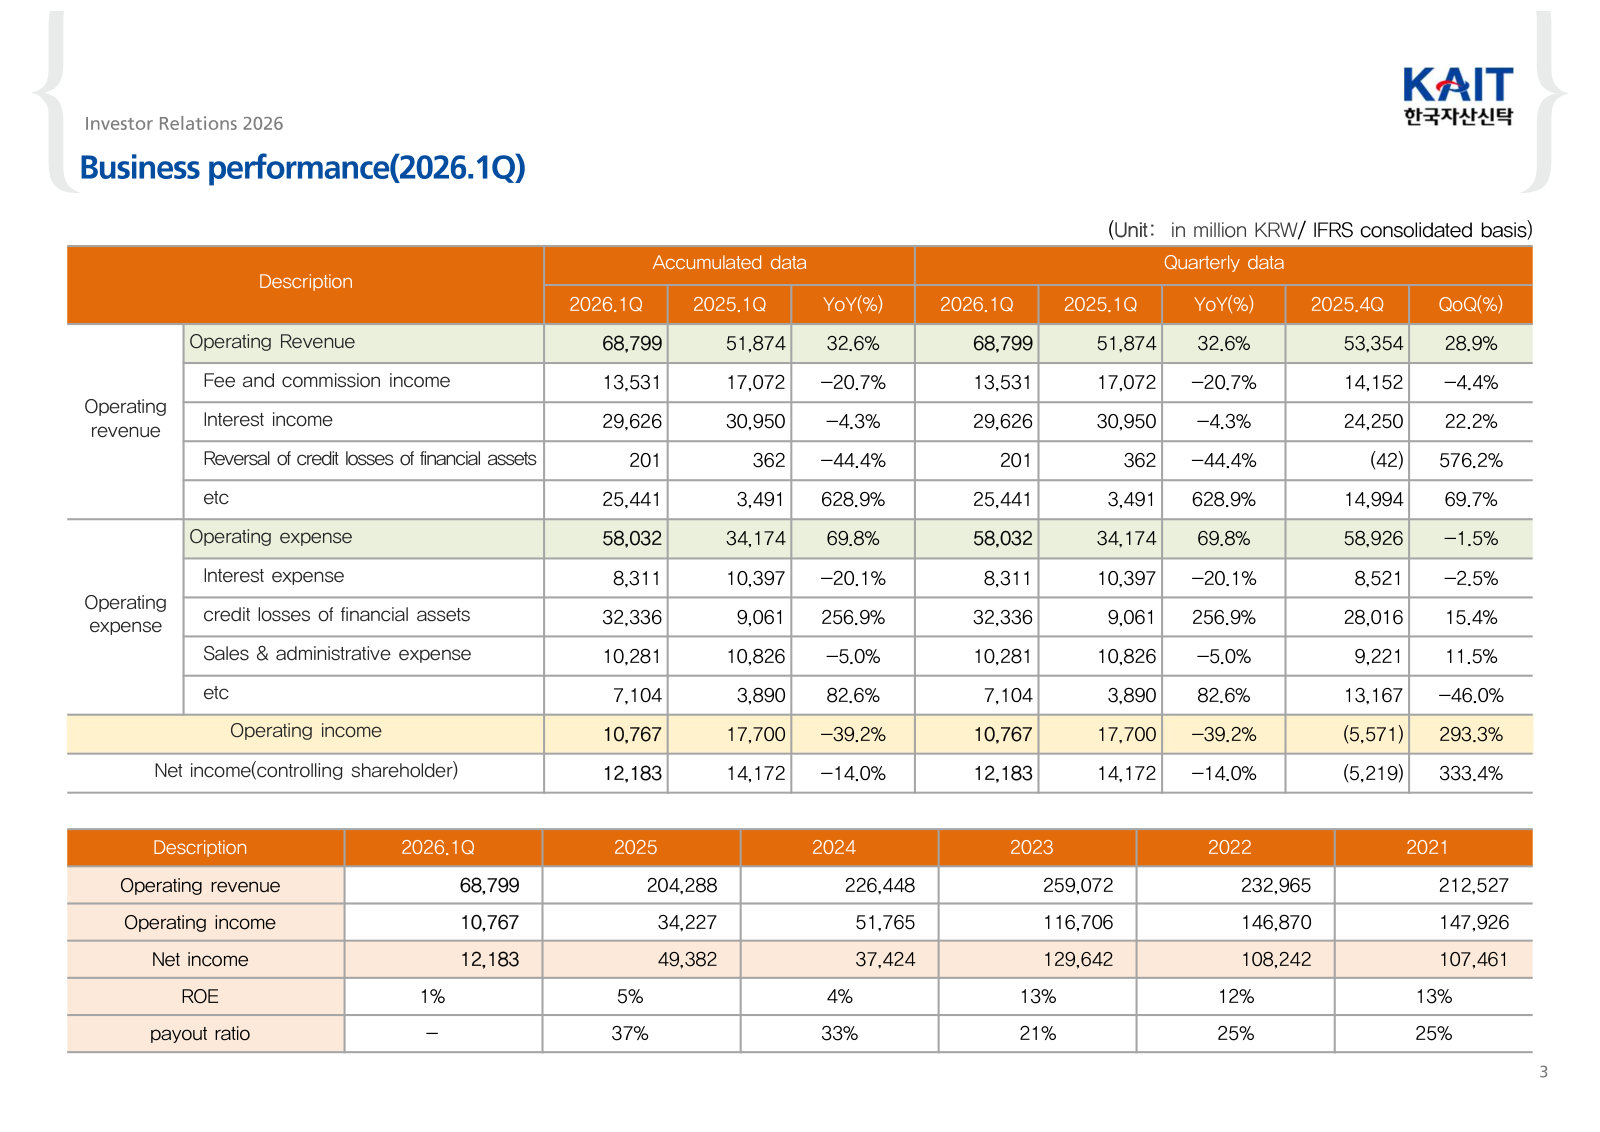
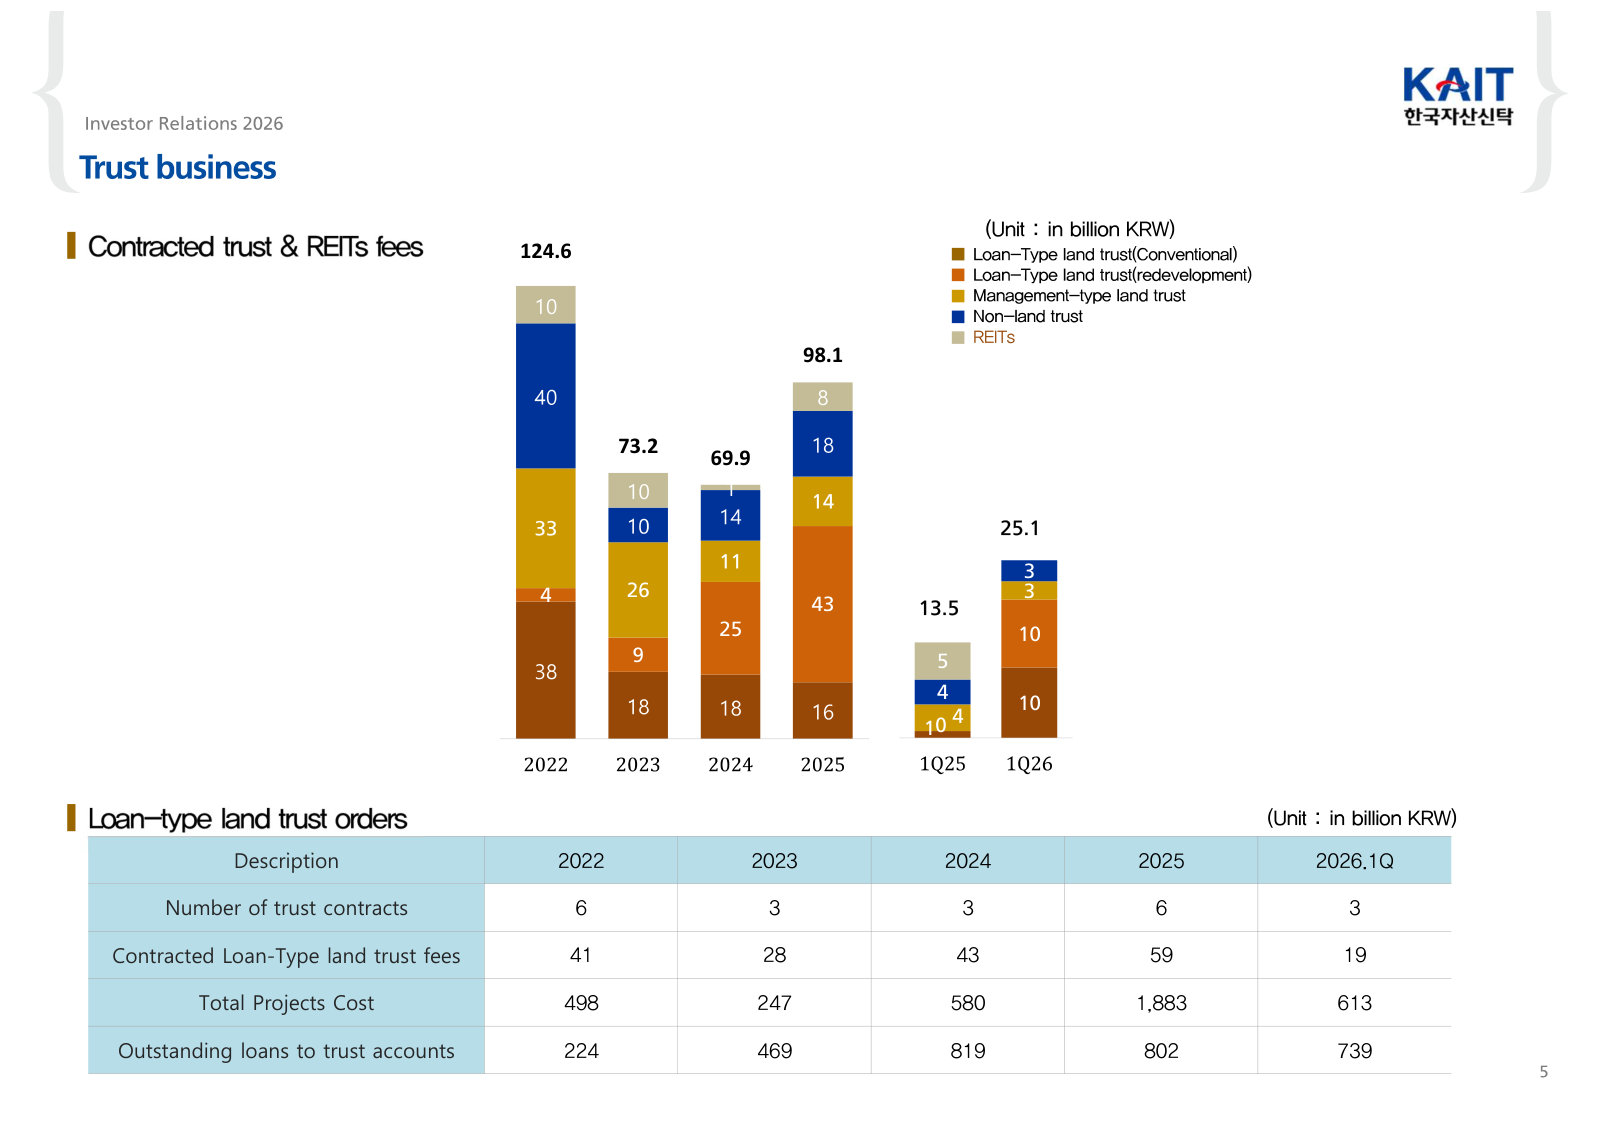
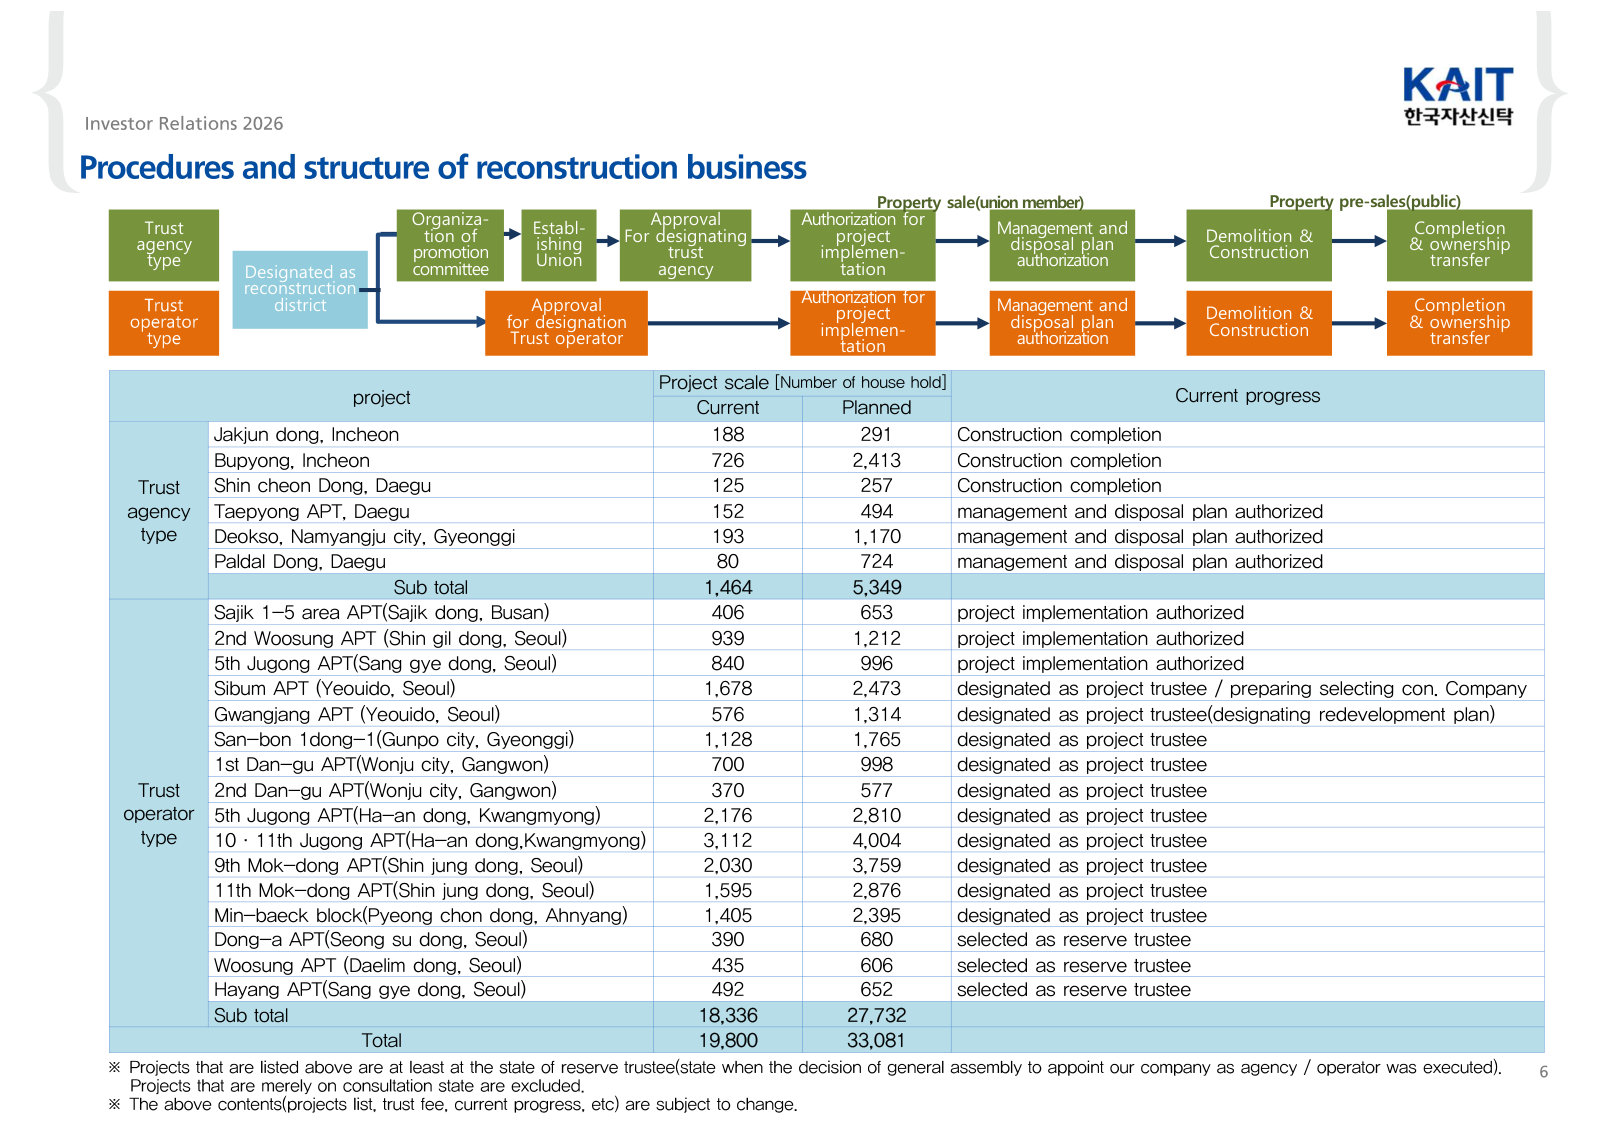
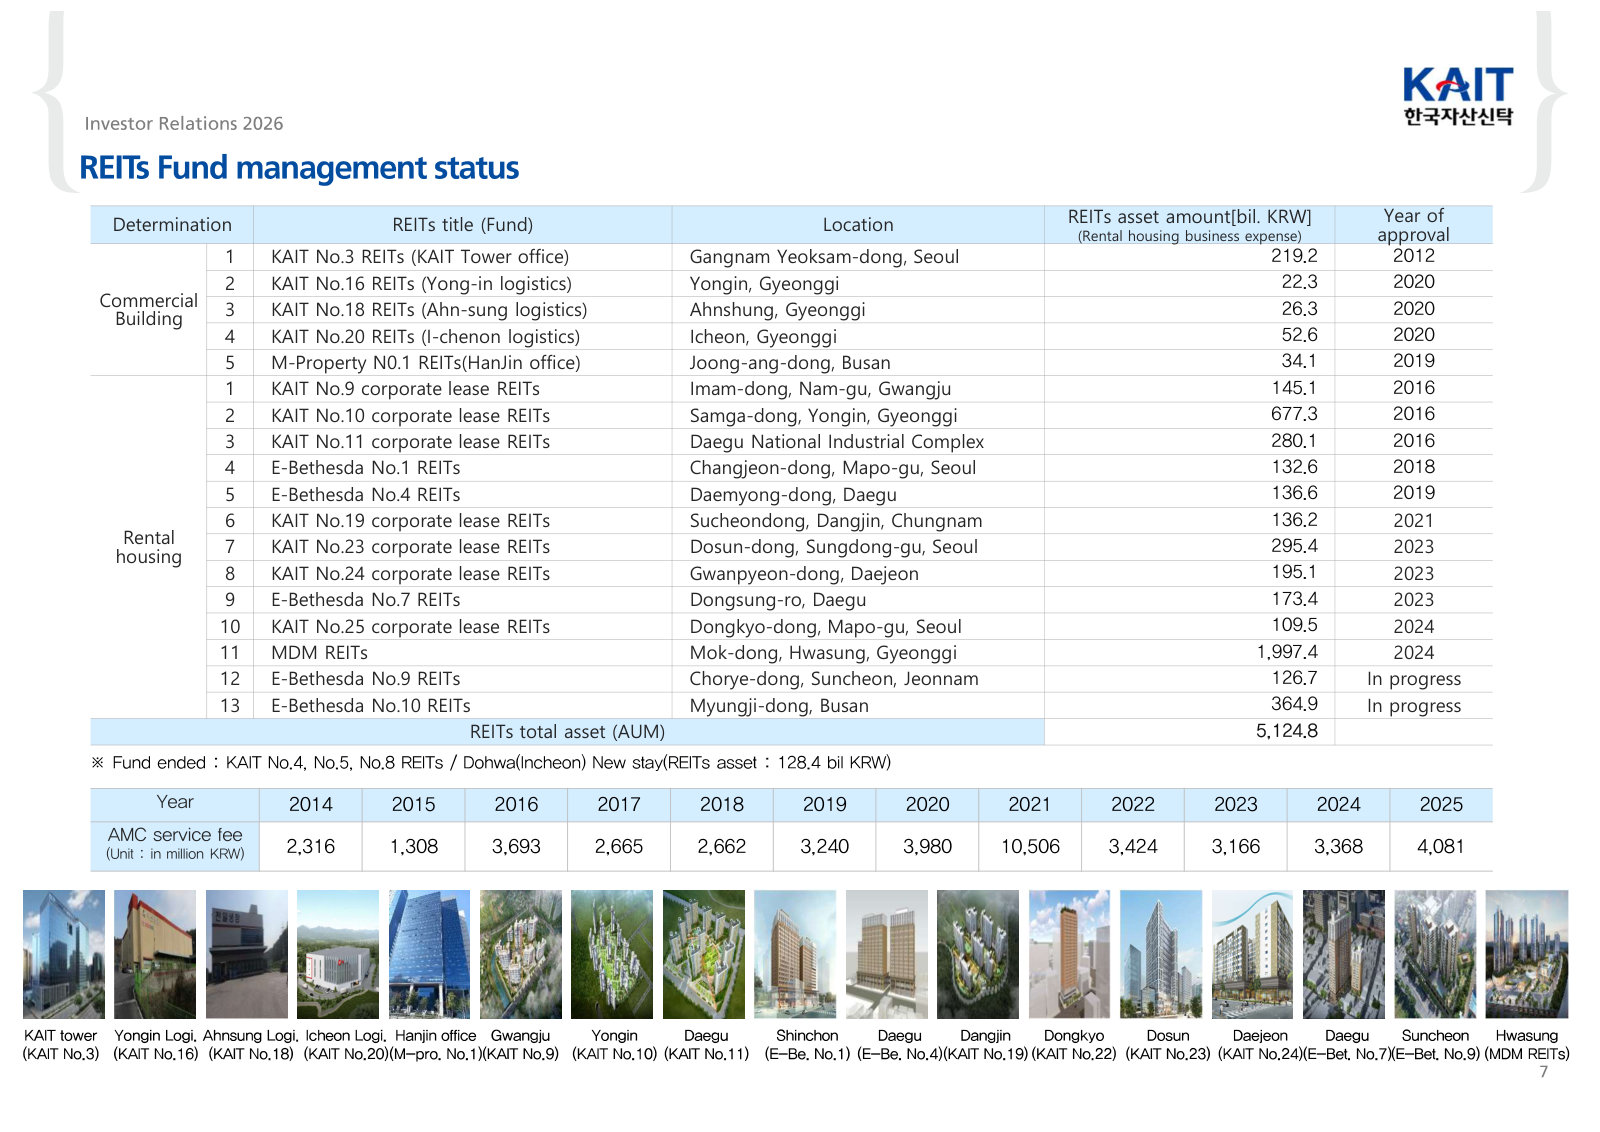
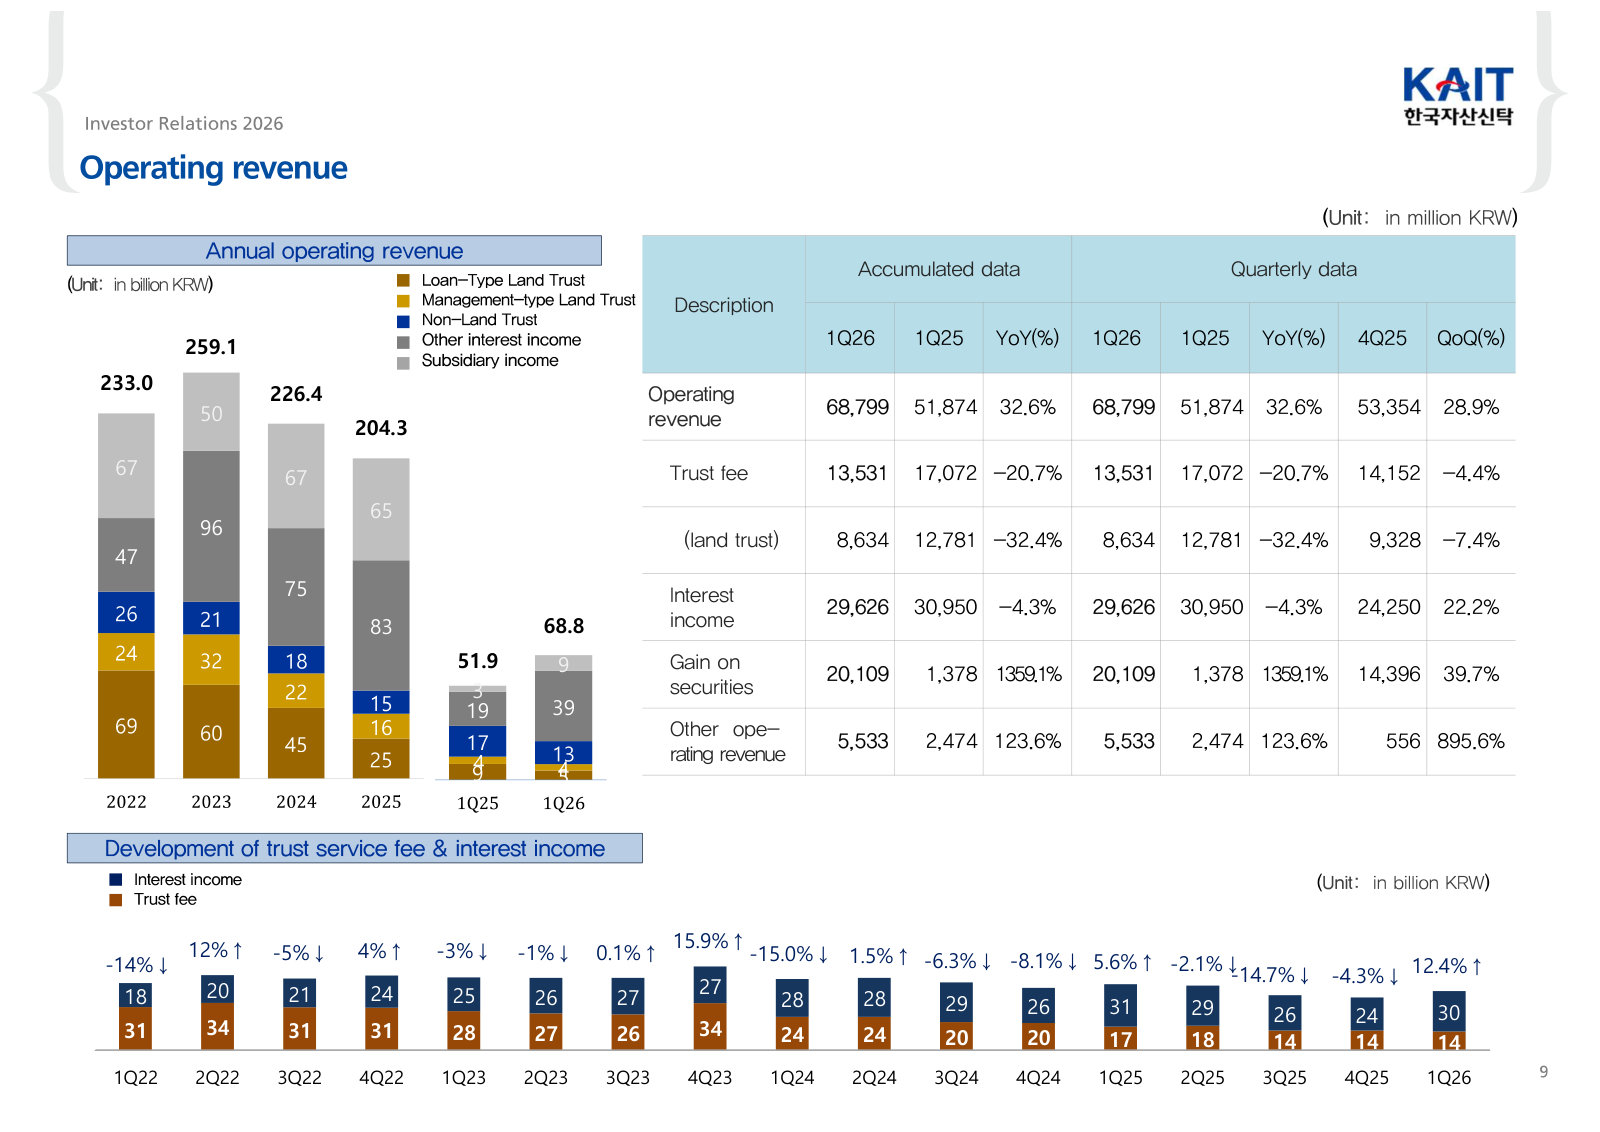
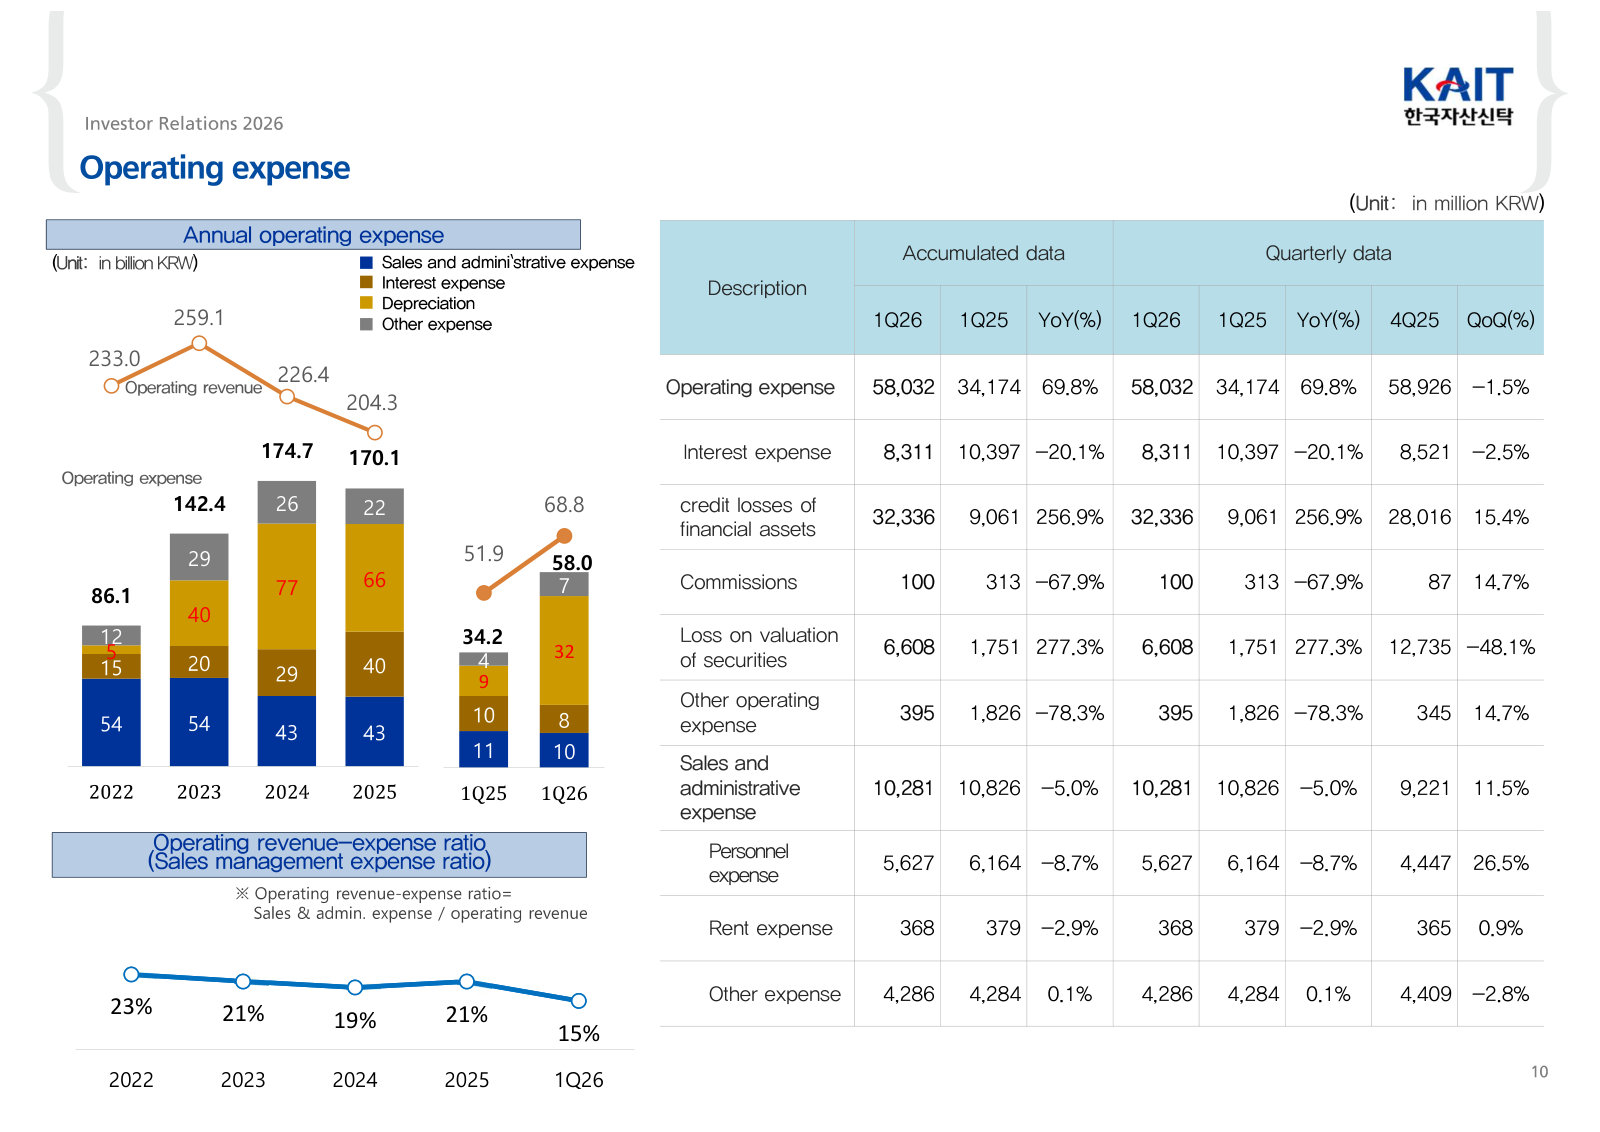
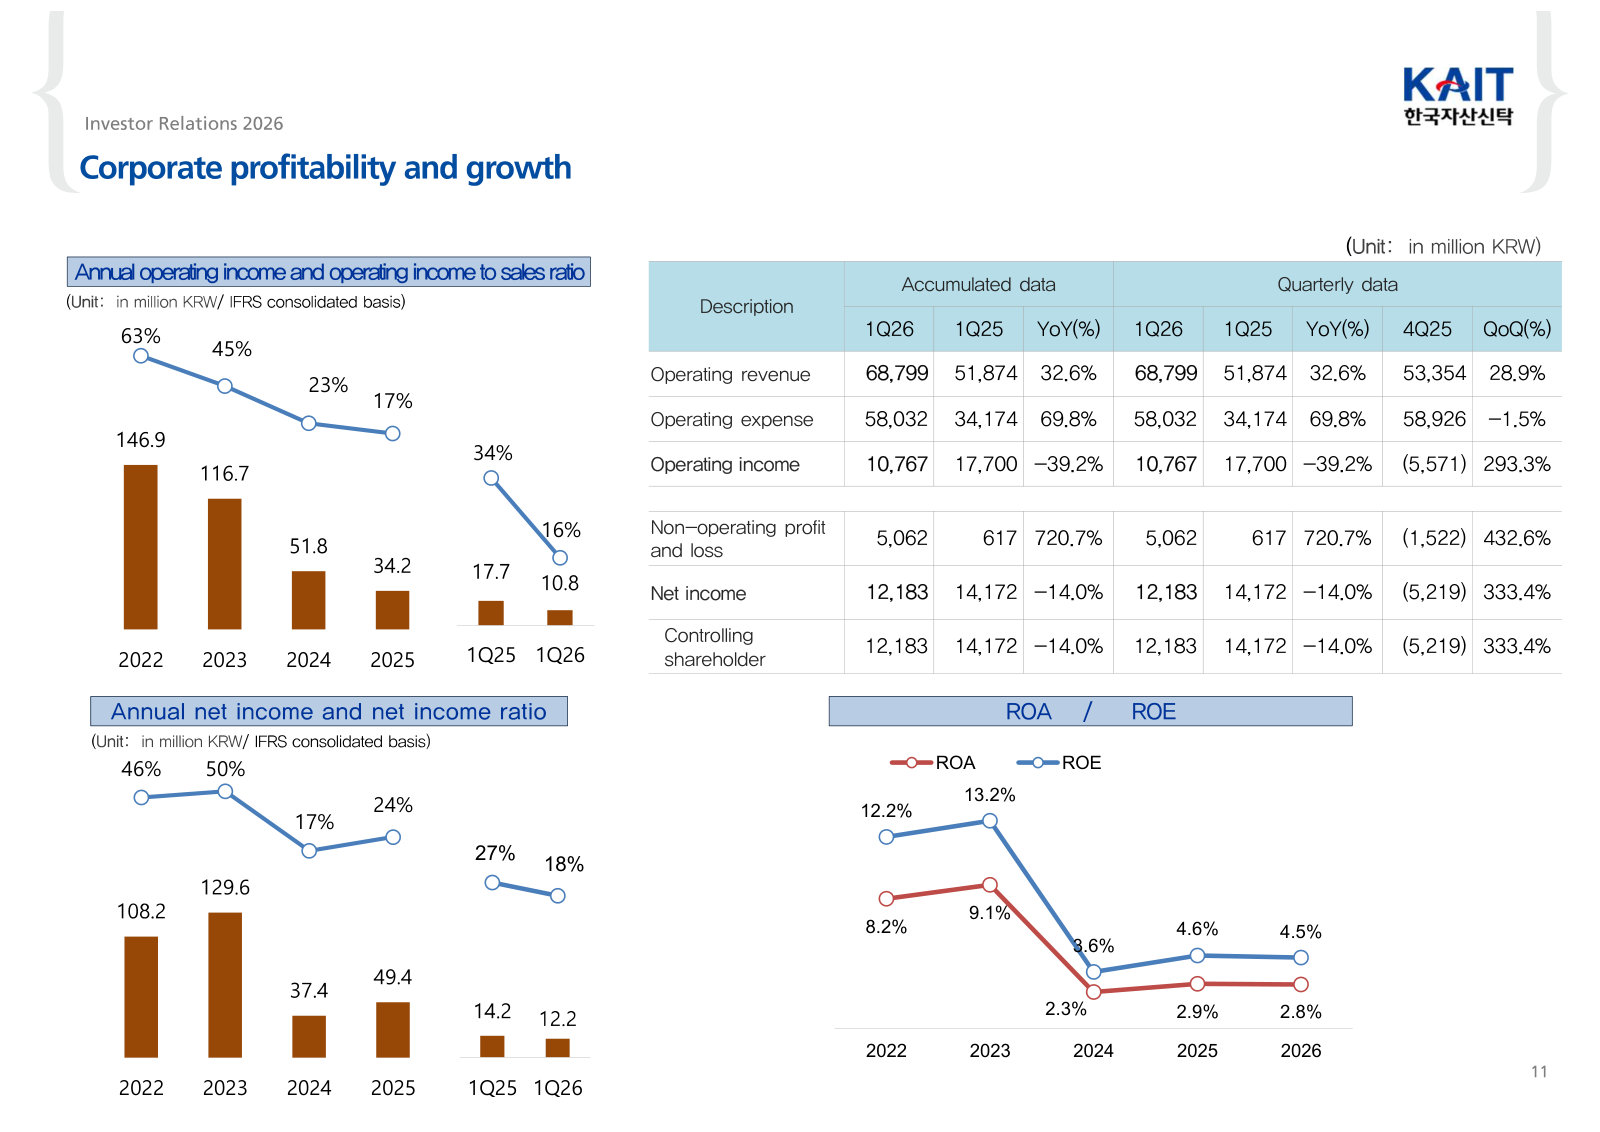
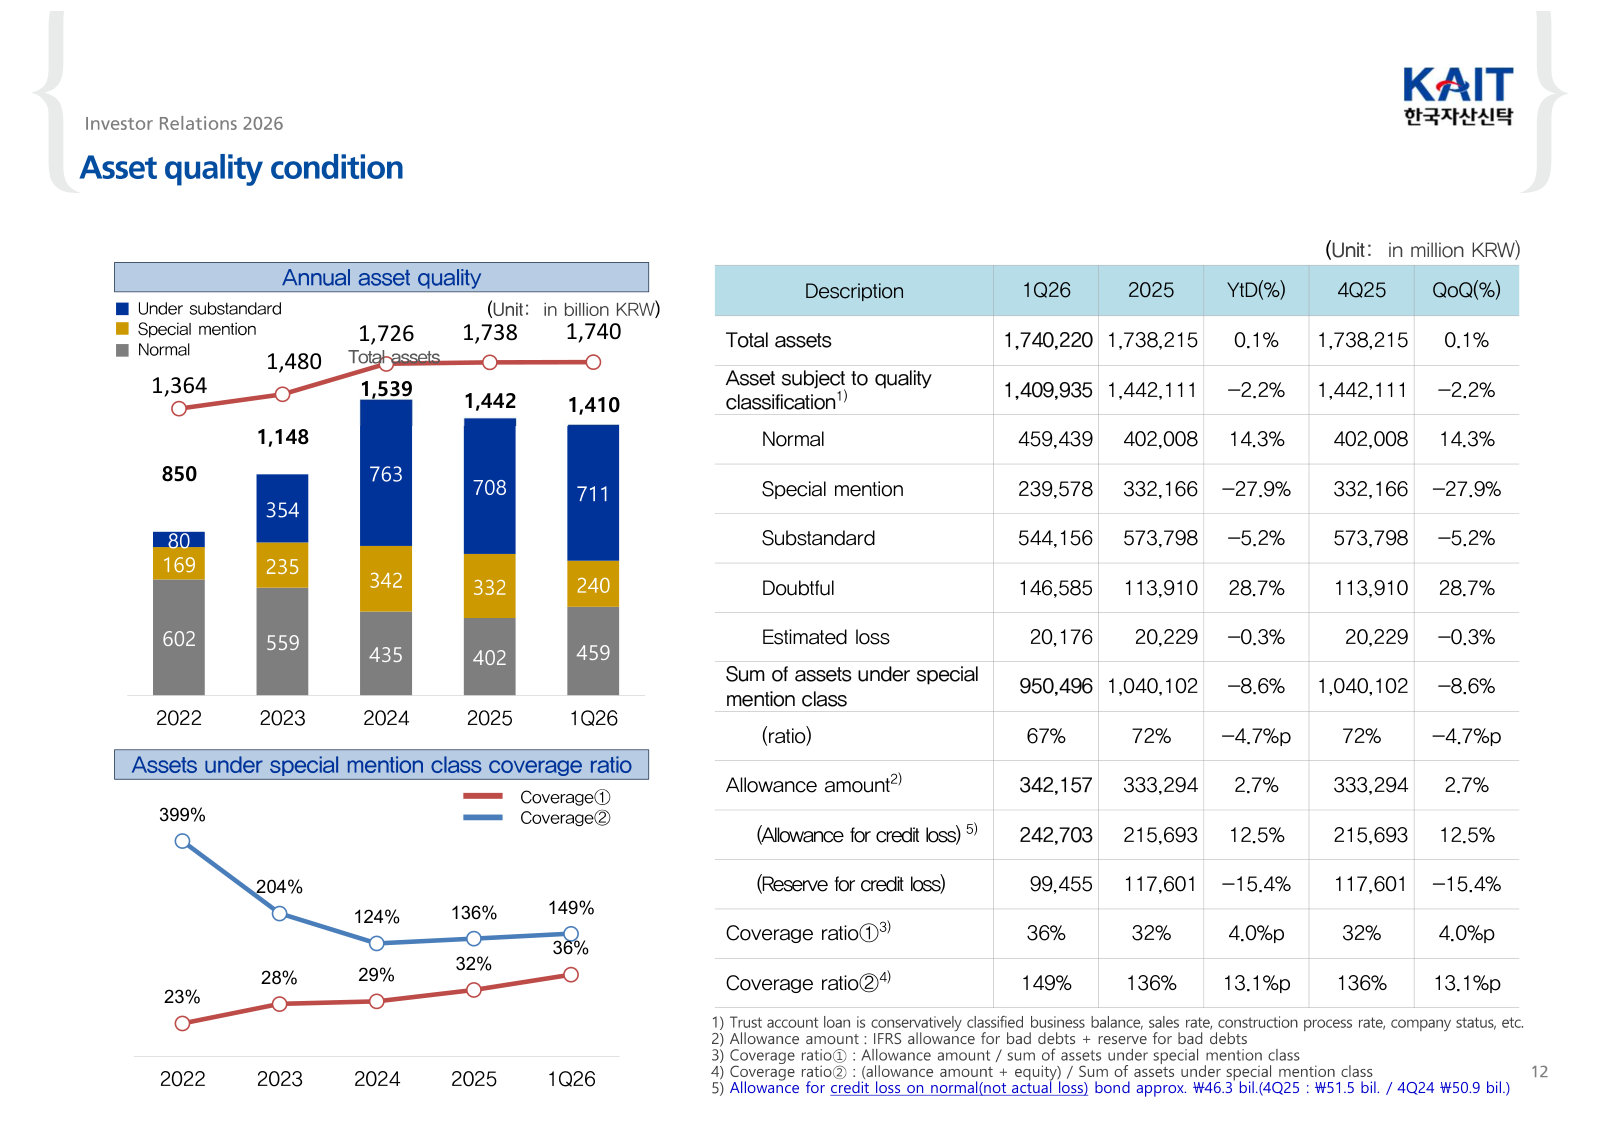
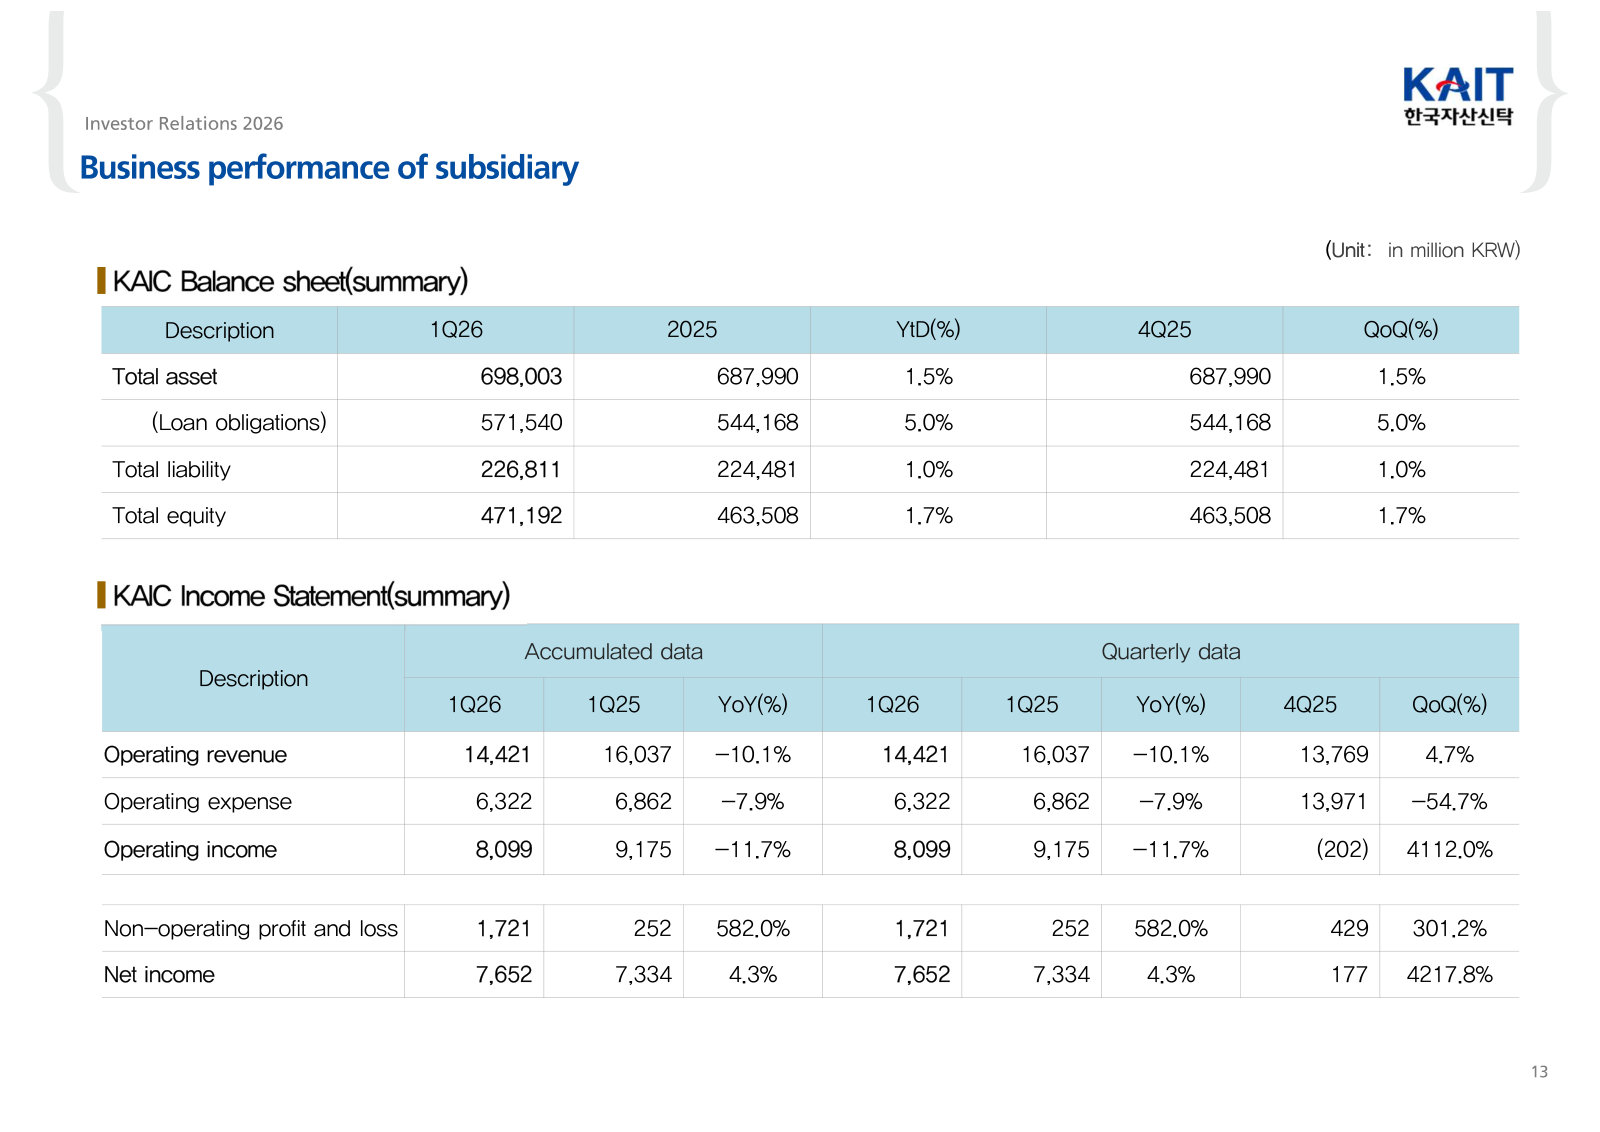
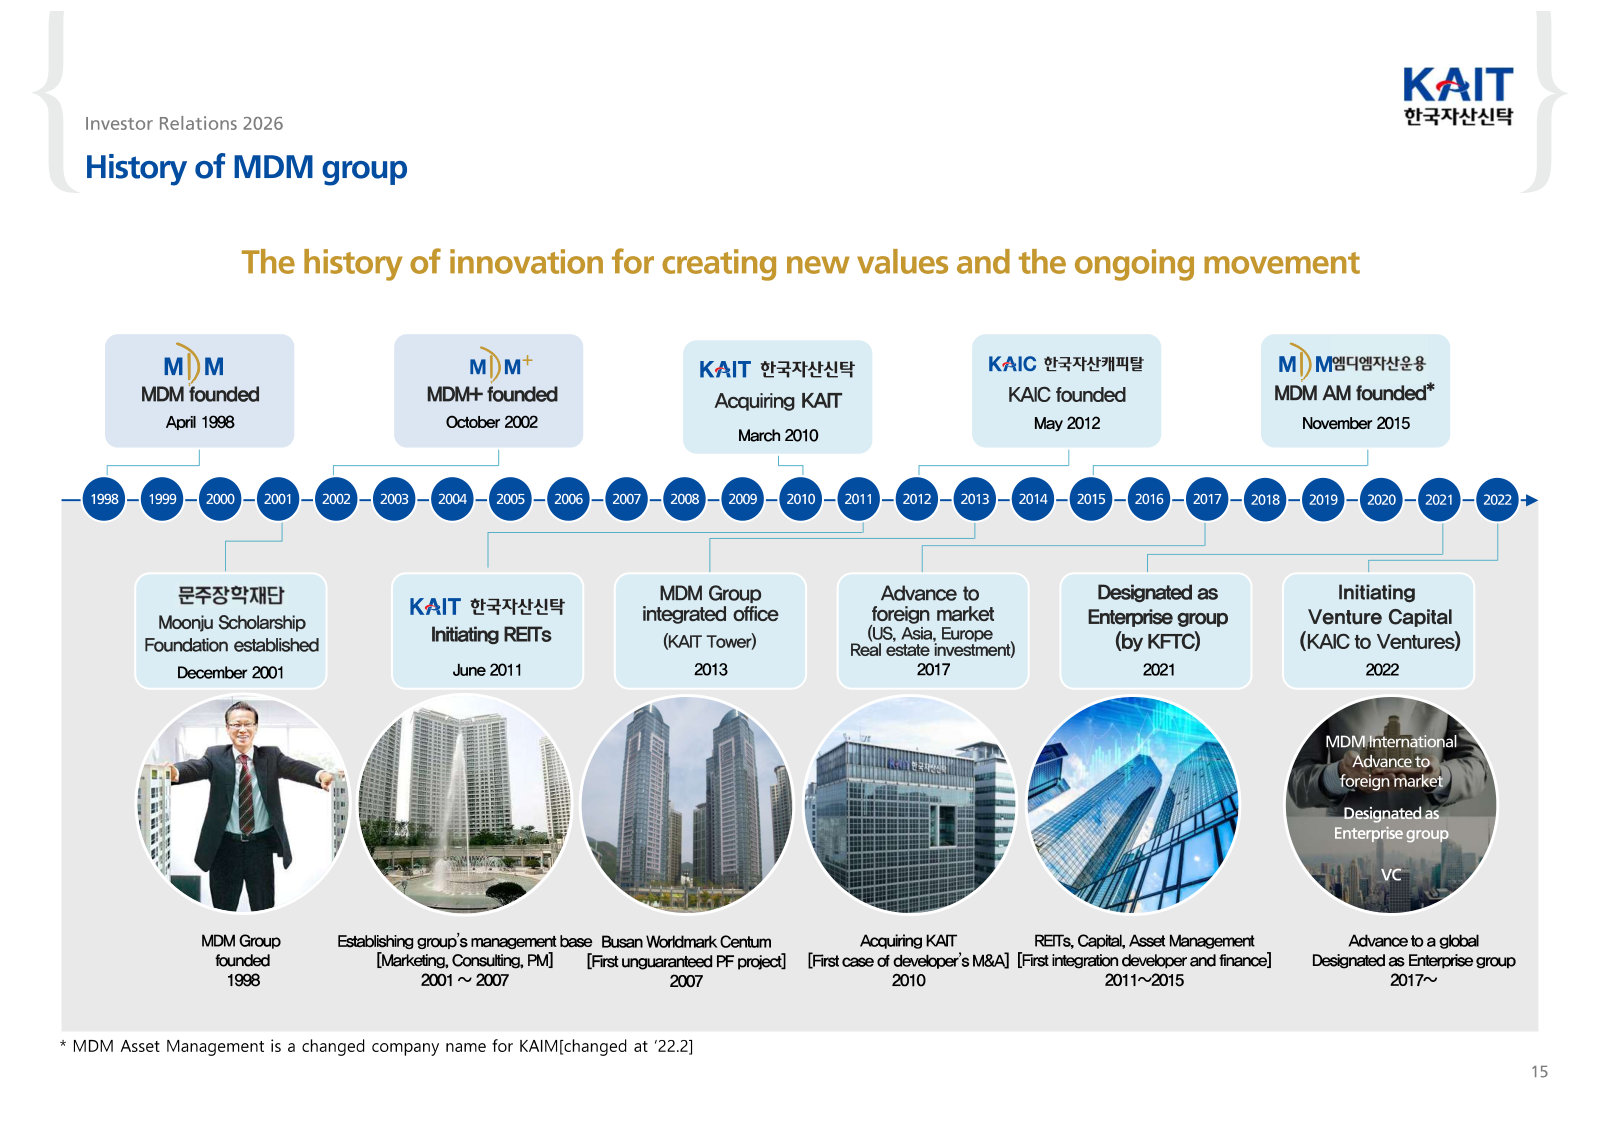
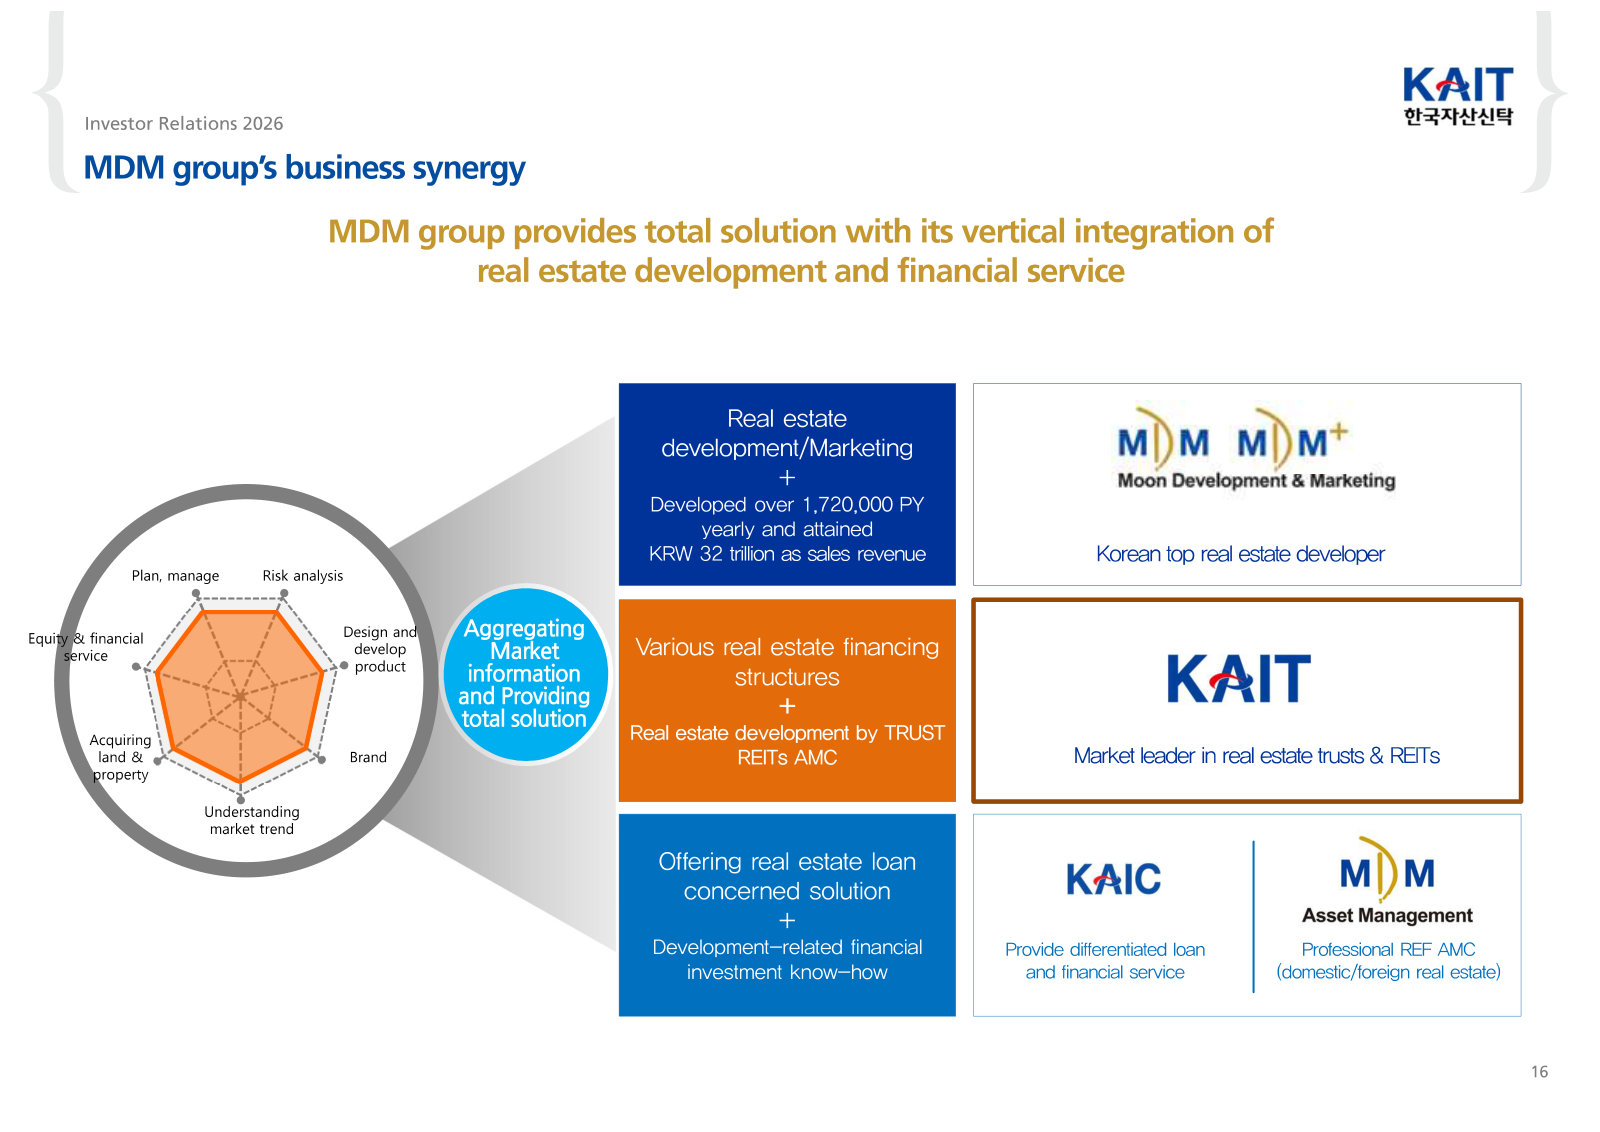
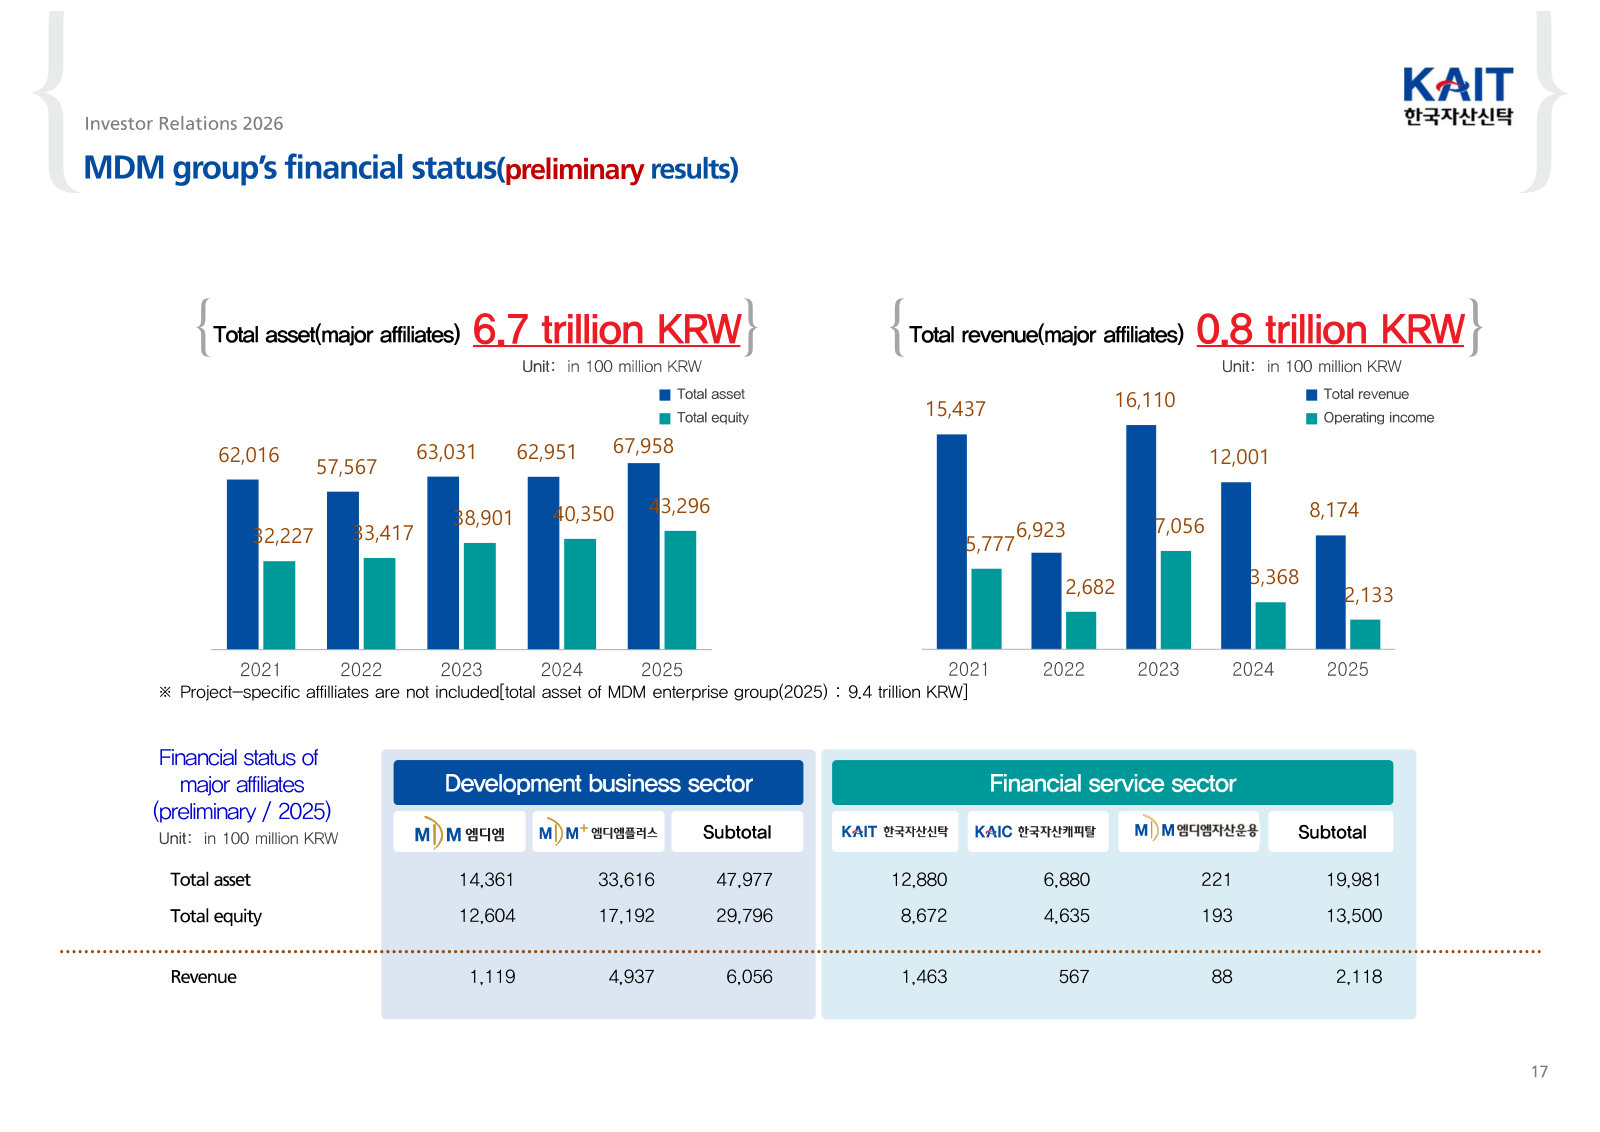
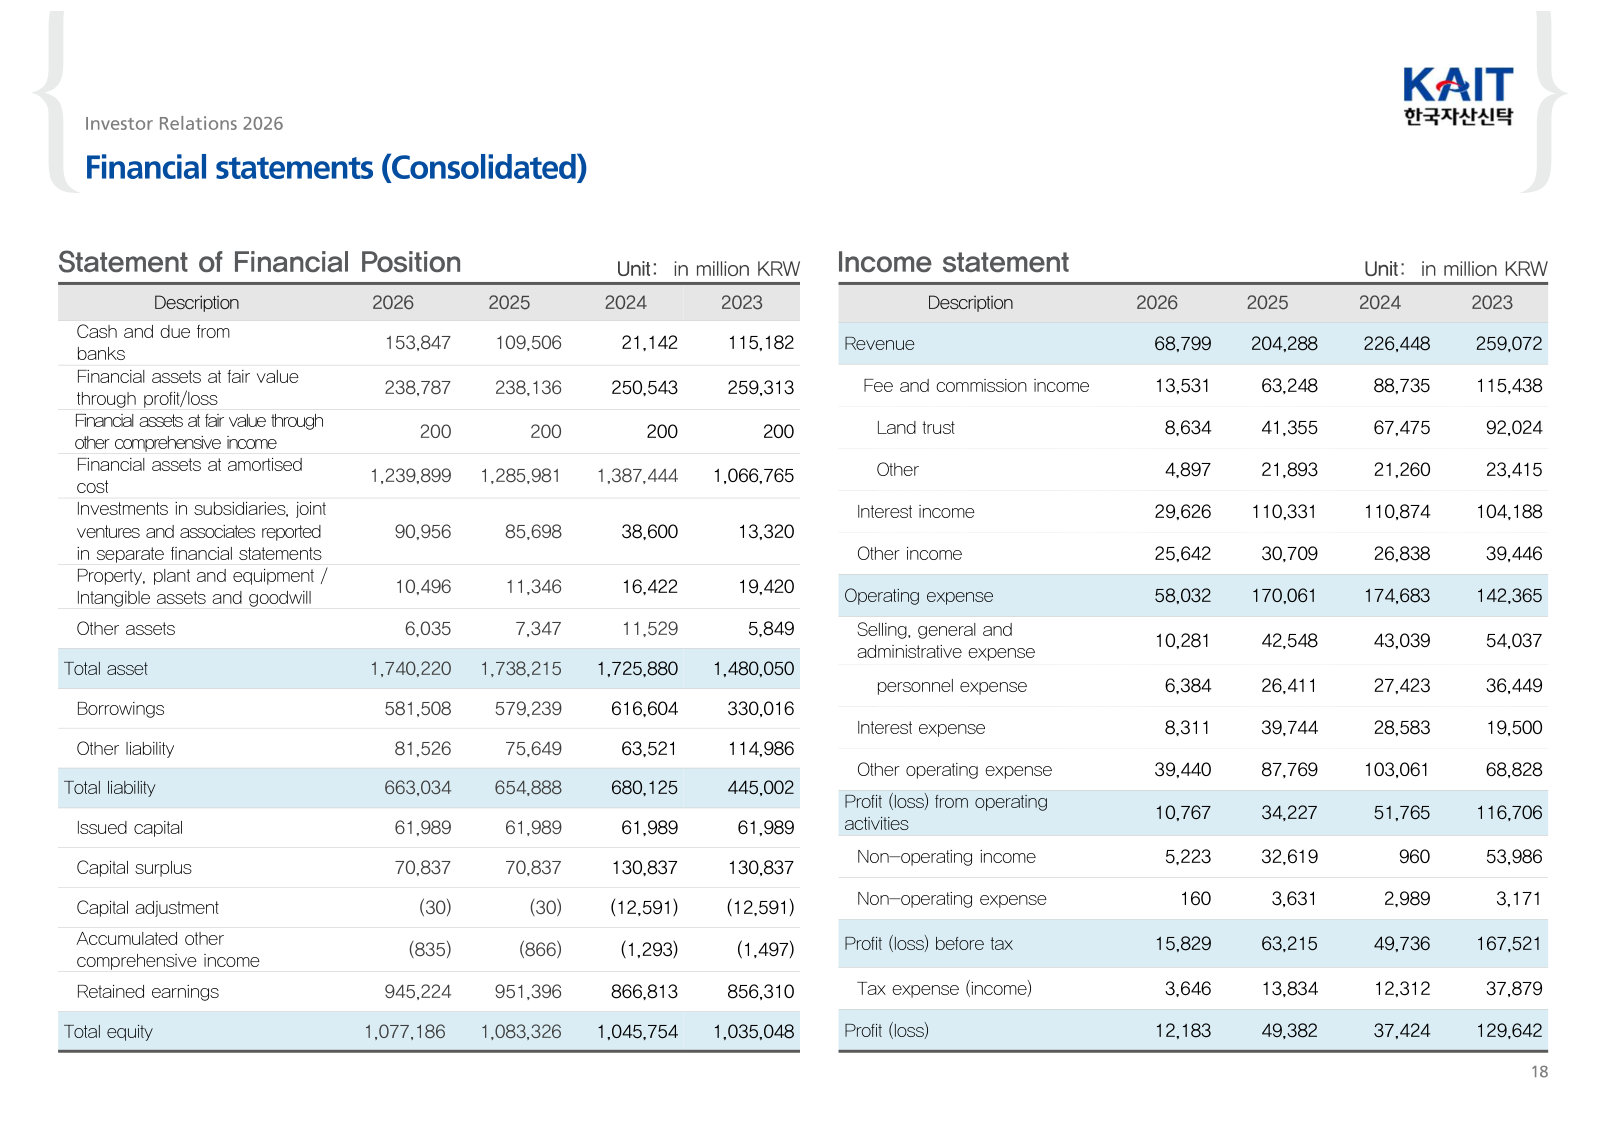
Earnings Release for 3Q 2023 — 3Q 2023
The one long-form edition of the deck, carrying market history, land-trust project economics and demand drivers that later editions dropped. · Open the full document →
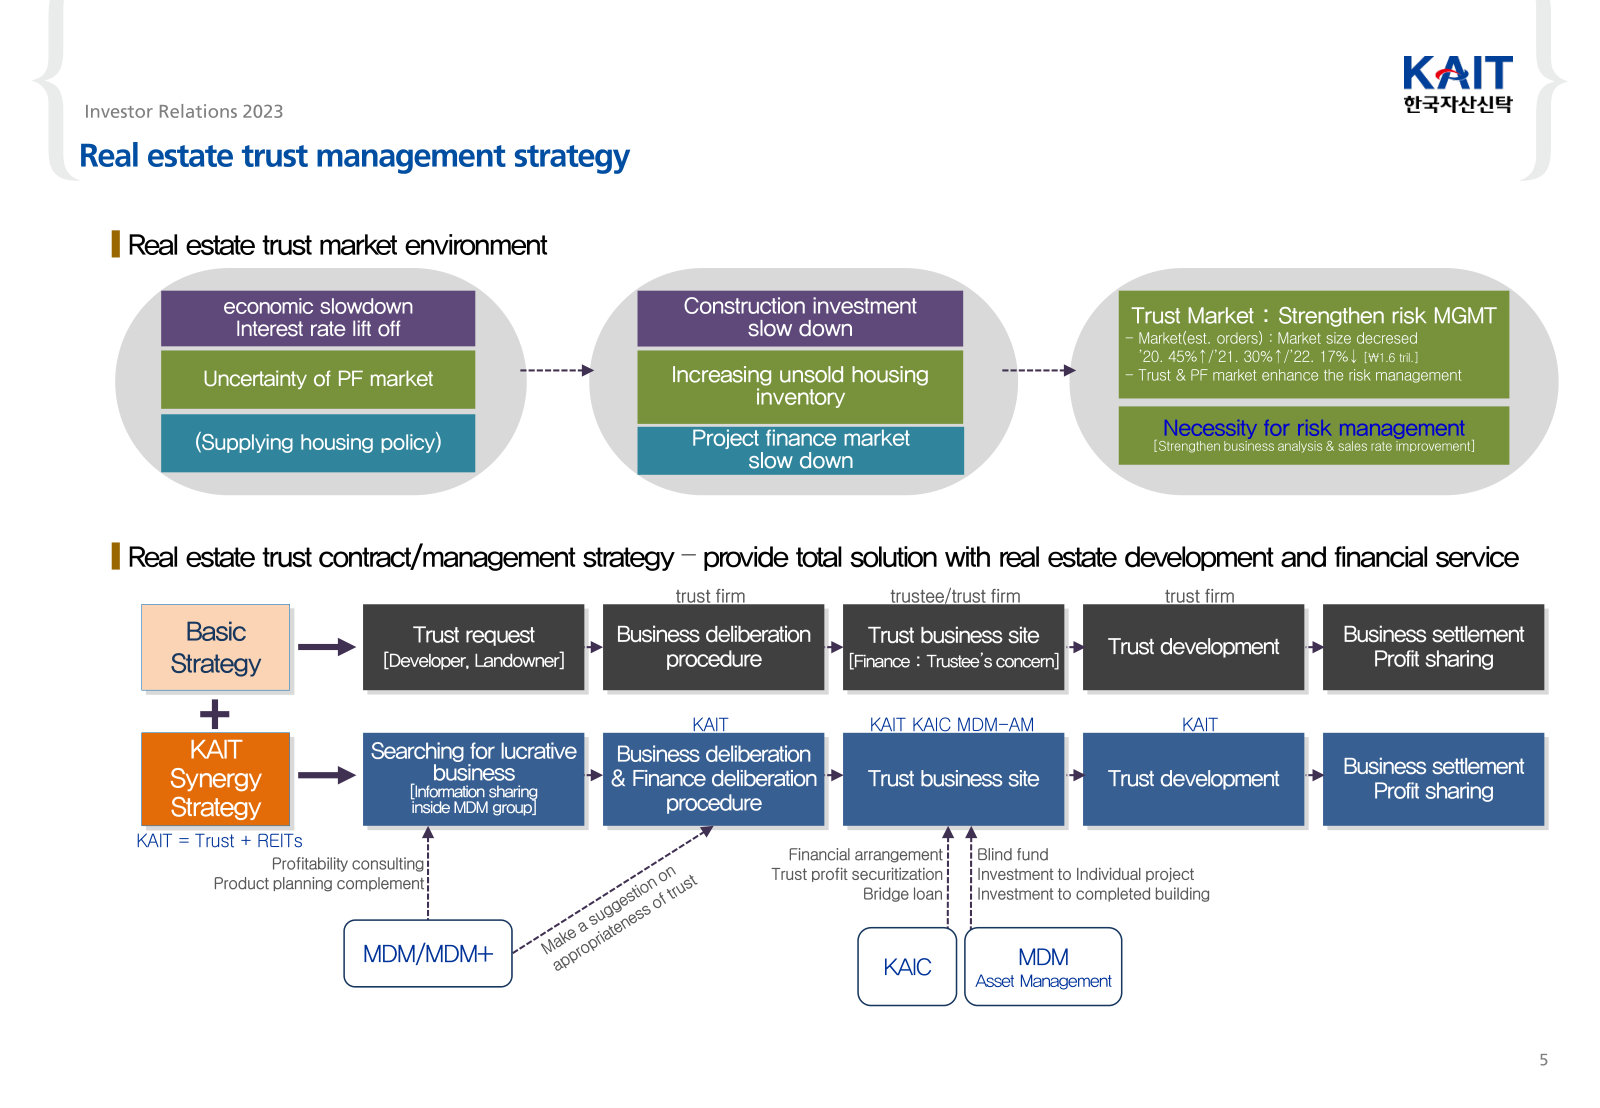
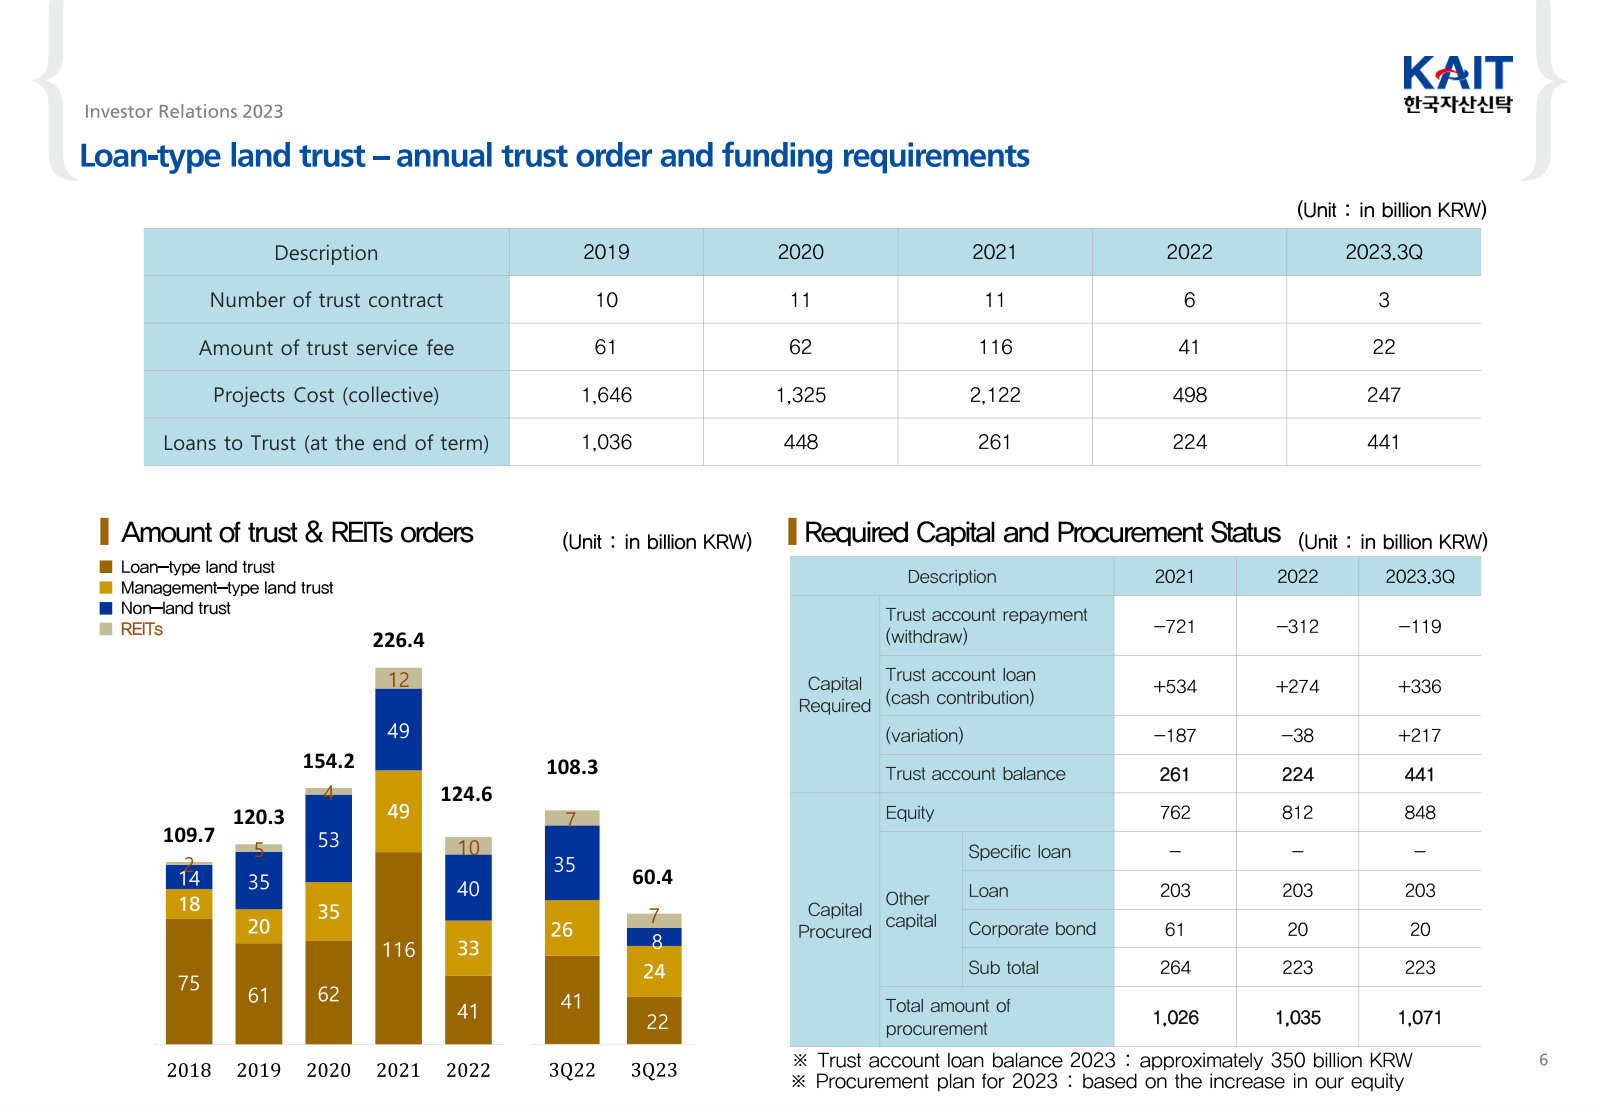
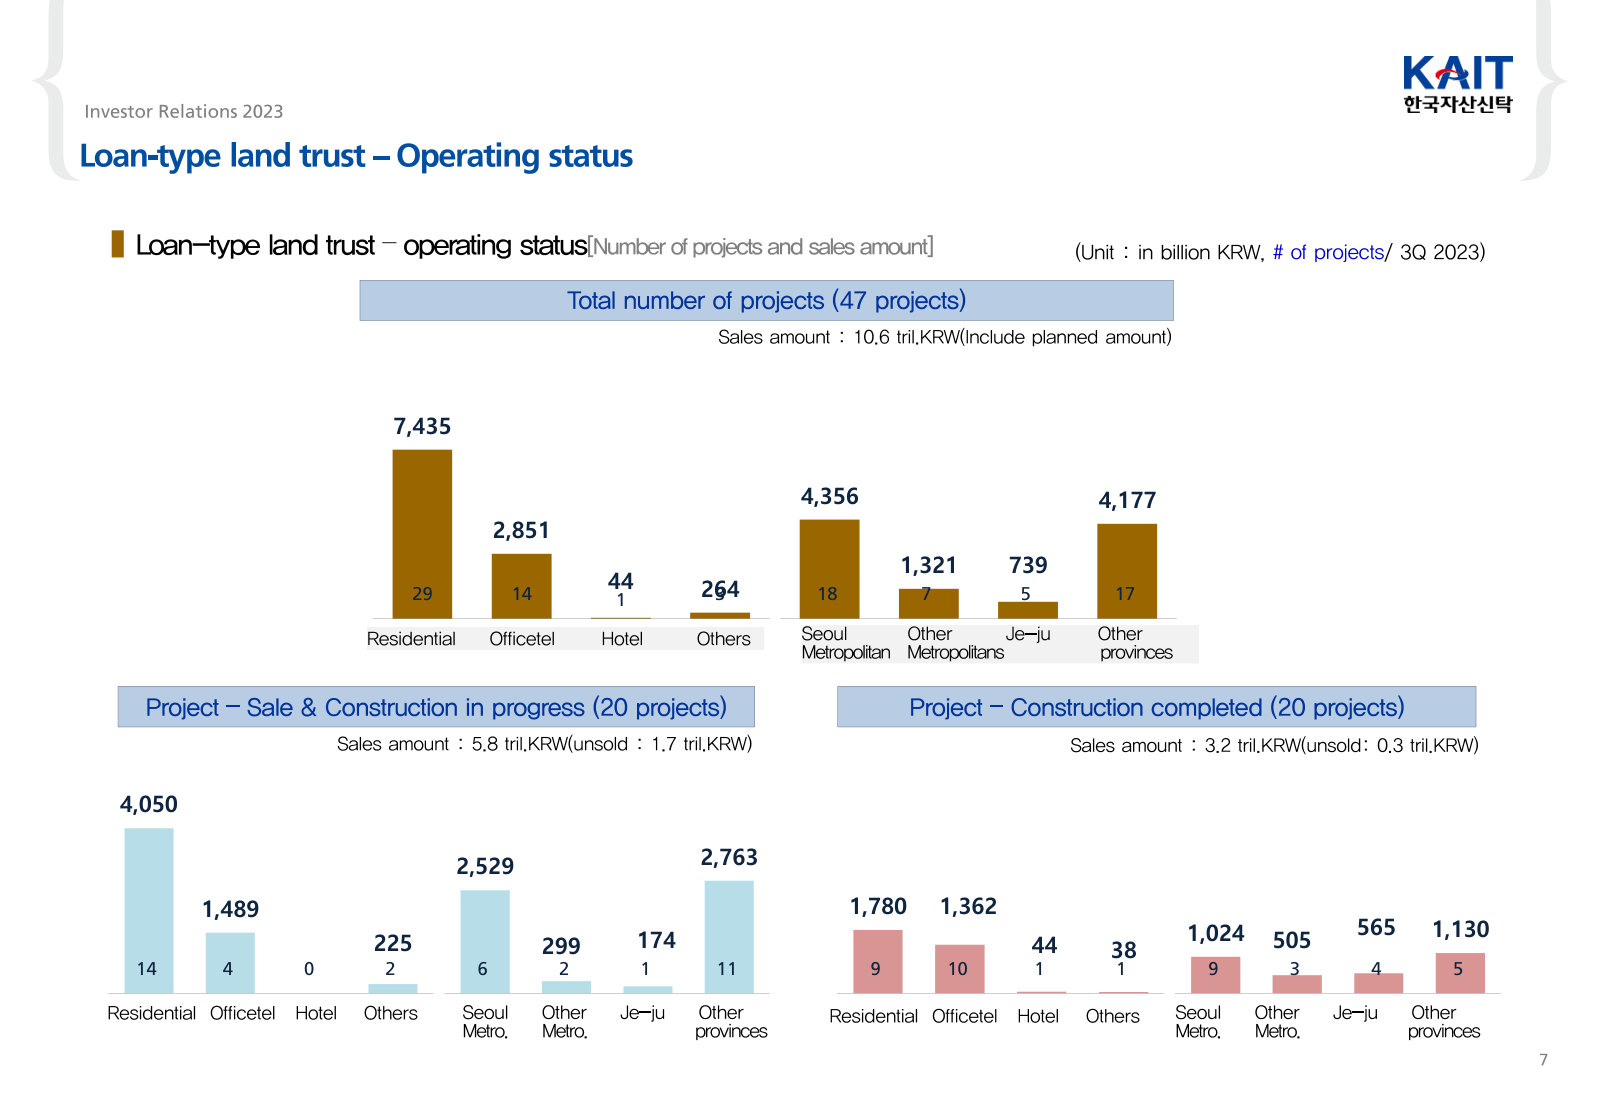
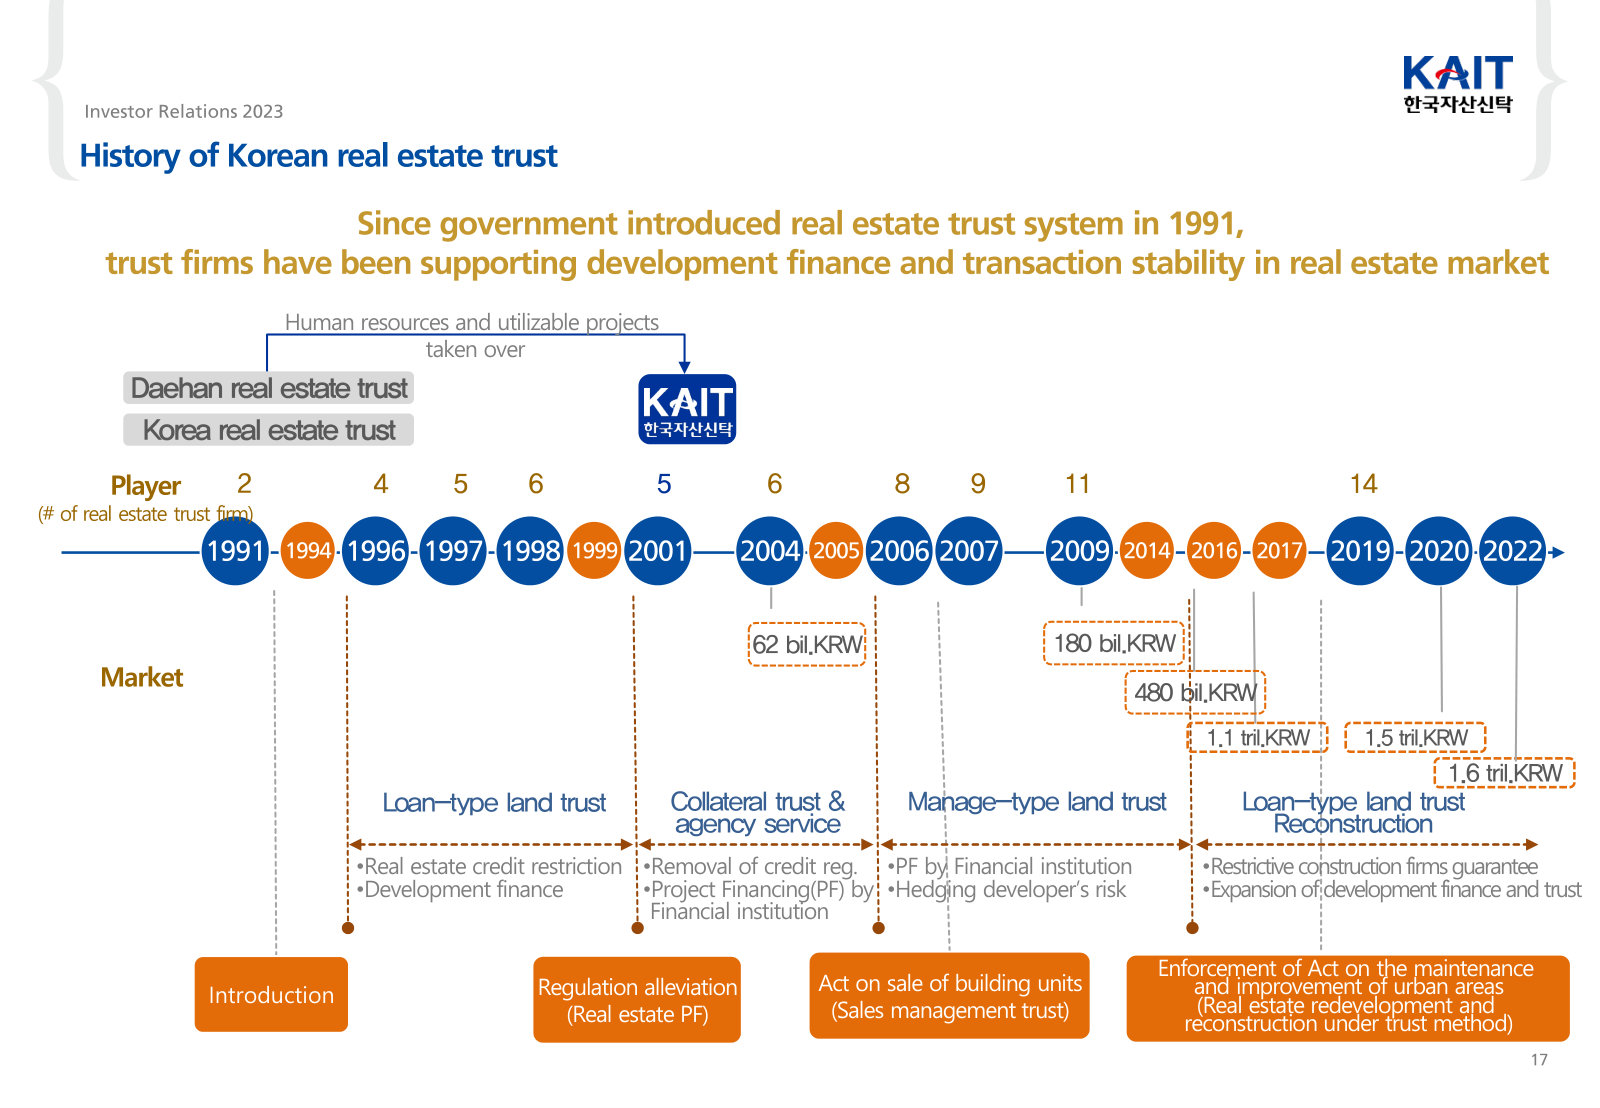
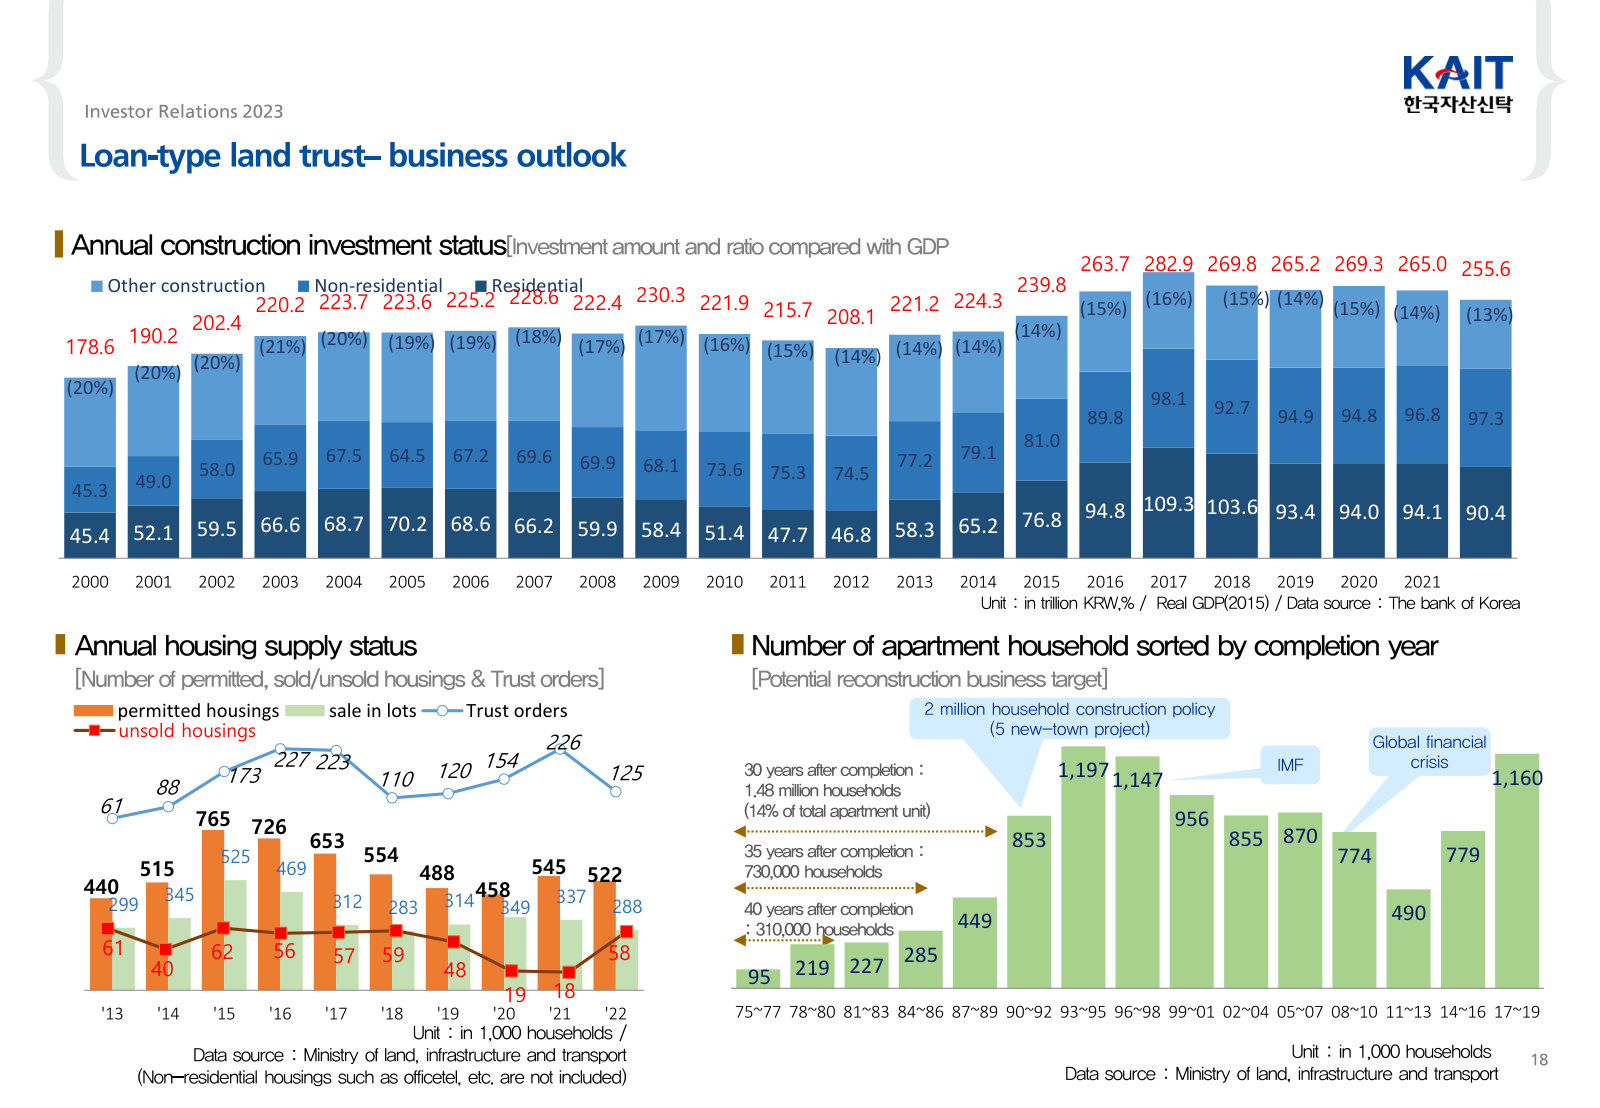
More from management
Earnings Release for 2025 — FY2025 · 20 pages · Full-year 2025 results on the same template — the annual figures sitting behind the current quarterly deck. · Open →
Earnings Release for 2024 — FY2024 · 20 pages · Full-year 2024, the year operating income more than halved and credit costs took over the story. · Open →
Earnings Release for 2023 — FY2023 · 20 pages · Full-year 2023, the last year of ₩100bn+ net income — the pre-downturn baseline this business used to earn. · Open →
Korea Asset In Trust Co., Ltd.'s annual reports contain management's most considered account of the business. These are the sections, passages and visual pages worth opening in the originals preserved in Sources.
한국자산신탁 — FY2025 사업보고서 (제25기 Annual Business Report) — FY2025
The latest annual filing, and the one that shows the full downcycle: fees halved, half of classified assets substandard-or-below, and the responsible-completion book run off. · Open the full document →
II. 사업의 내용 · 2. 영업의 현황 — p. 22 · Read the full section →
Management's own account of the franchise and of the trust products it sells, including the development-vs-management land-trust split.
How the trust business was assembled, from the 2001 licence to the group's one-stop property-finance model.
당사는 2001년 3월 20일 법인을 설립하고, 같은 해 4월 4일 (구)신탁업법에 근거하여 신탁업 인가를 취득한 후 업무를 개시하였습니다. 업무 개시 직후 대한부동산신탁(이후 코레트신탁으로 상호 변경, 현재 법인 청산) 및 한국부동산신탁(현재 법인 청산)으로부터 우량 자산(토지신탁 개발사업)과 인력, 전산설비 등을 양수하여 영업 기반을 구축하였습니다. […] 이후 주택 개발 등 토지신탁 사업과 담보신탁, 대리사무 등 비토지신탁 사업을 중점적으로수주하며 신탁 사업 영역을 지속적으로 확대해 왔습니다. 더불어 리츠(REITs) AMC, PFVAMC 등 다양한 부문으로도 진출함으로써 업무 외연을 넓혀 왔습니다. 또한 2012년 이후 캐피탈 등 금융 자회사를 설립하여 신탁ㆍ리츠ㆍ대출ㆍ투자ㆍ자산운용을 아우르는 부동산 금융 토탈 서비스를 제공함으로써, 종합 부동산 금융회사로서의 면모를 갖추게 되었습니다.
p. 22 · Read in context →
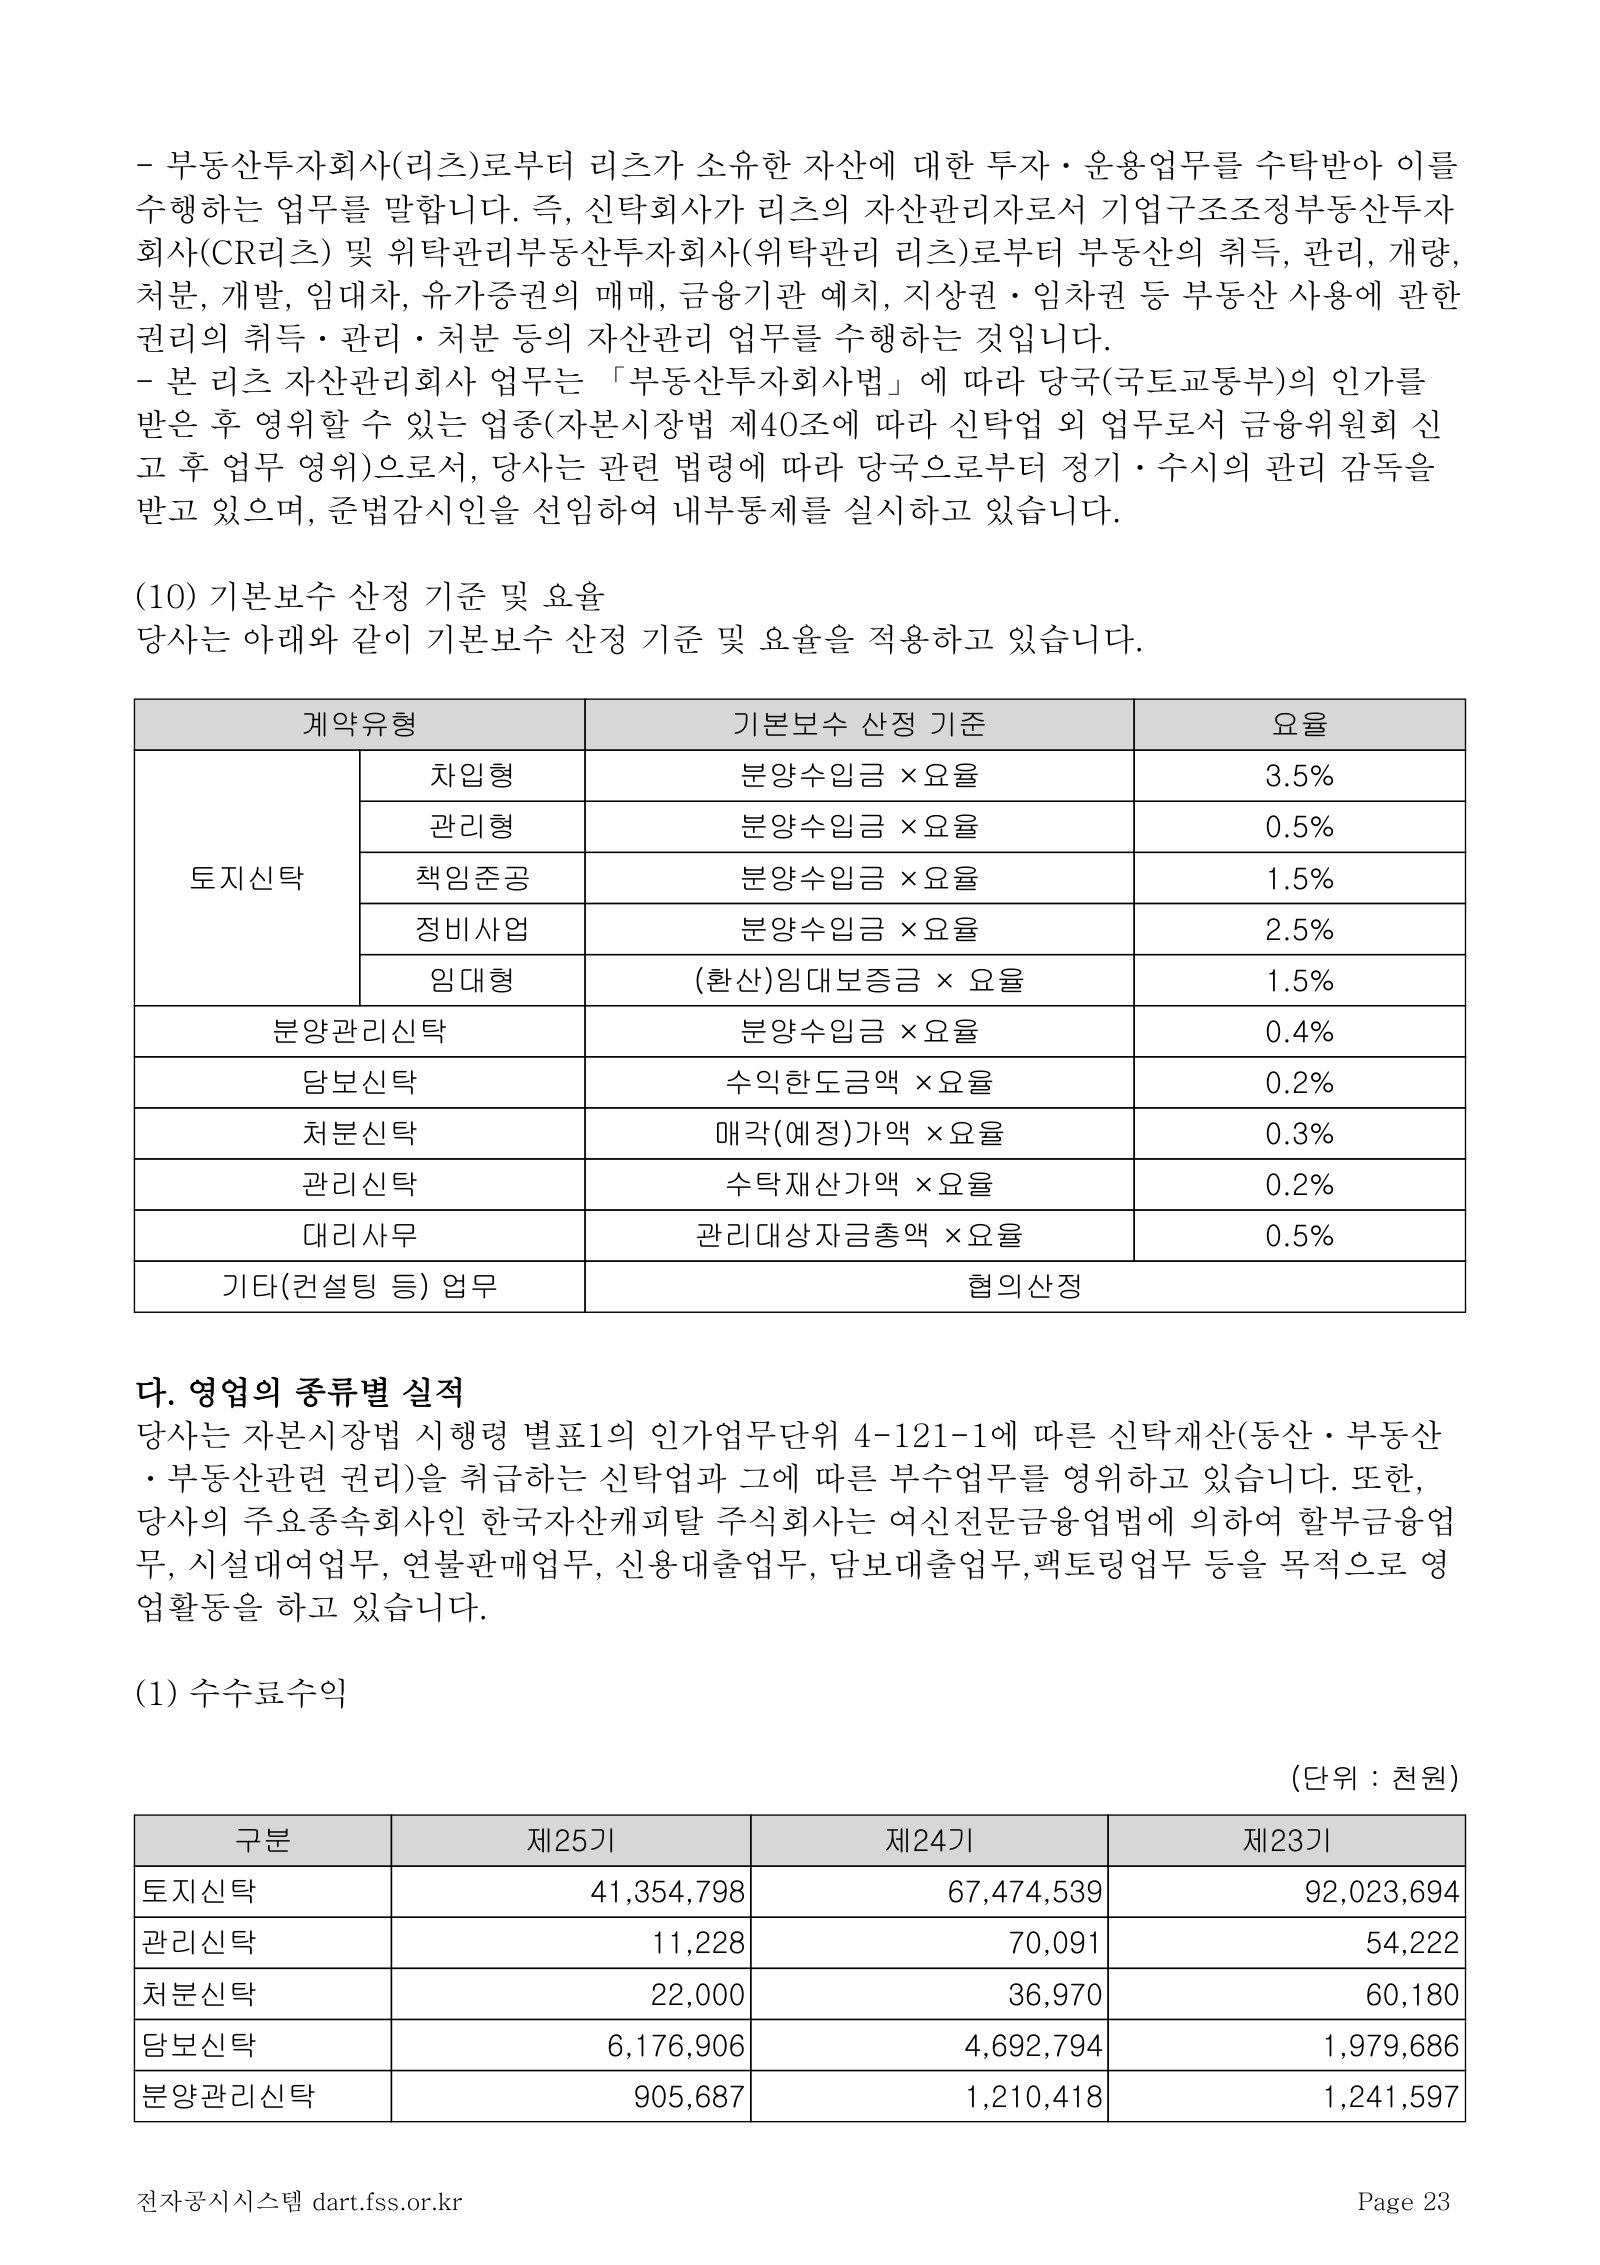
다. 영업의 종류별 실적 — p. 25 · Read the full section →
Trust assets and trust fees by product, three years side by side — land-trust AUM rose while land-trust fees fell from ₩92.0bn to ₩41.4bn.
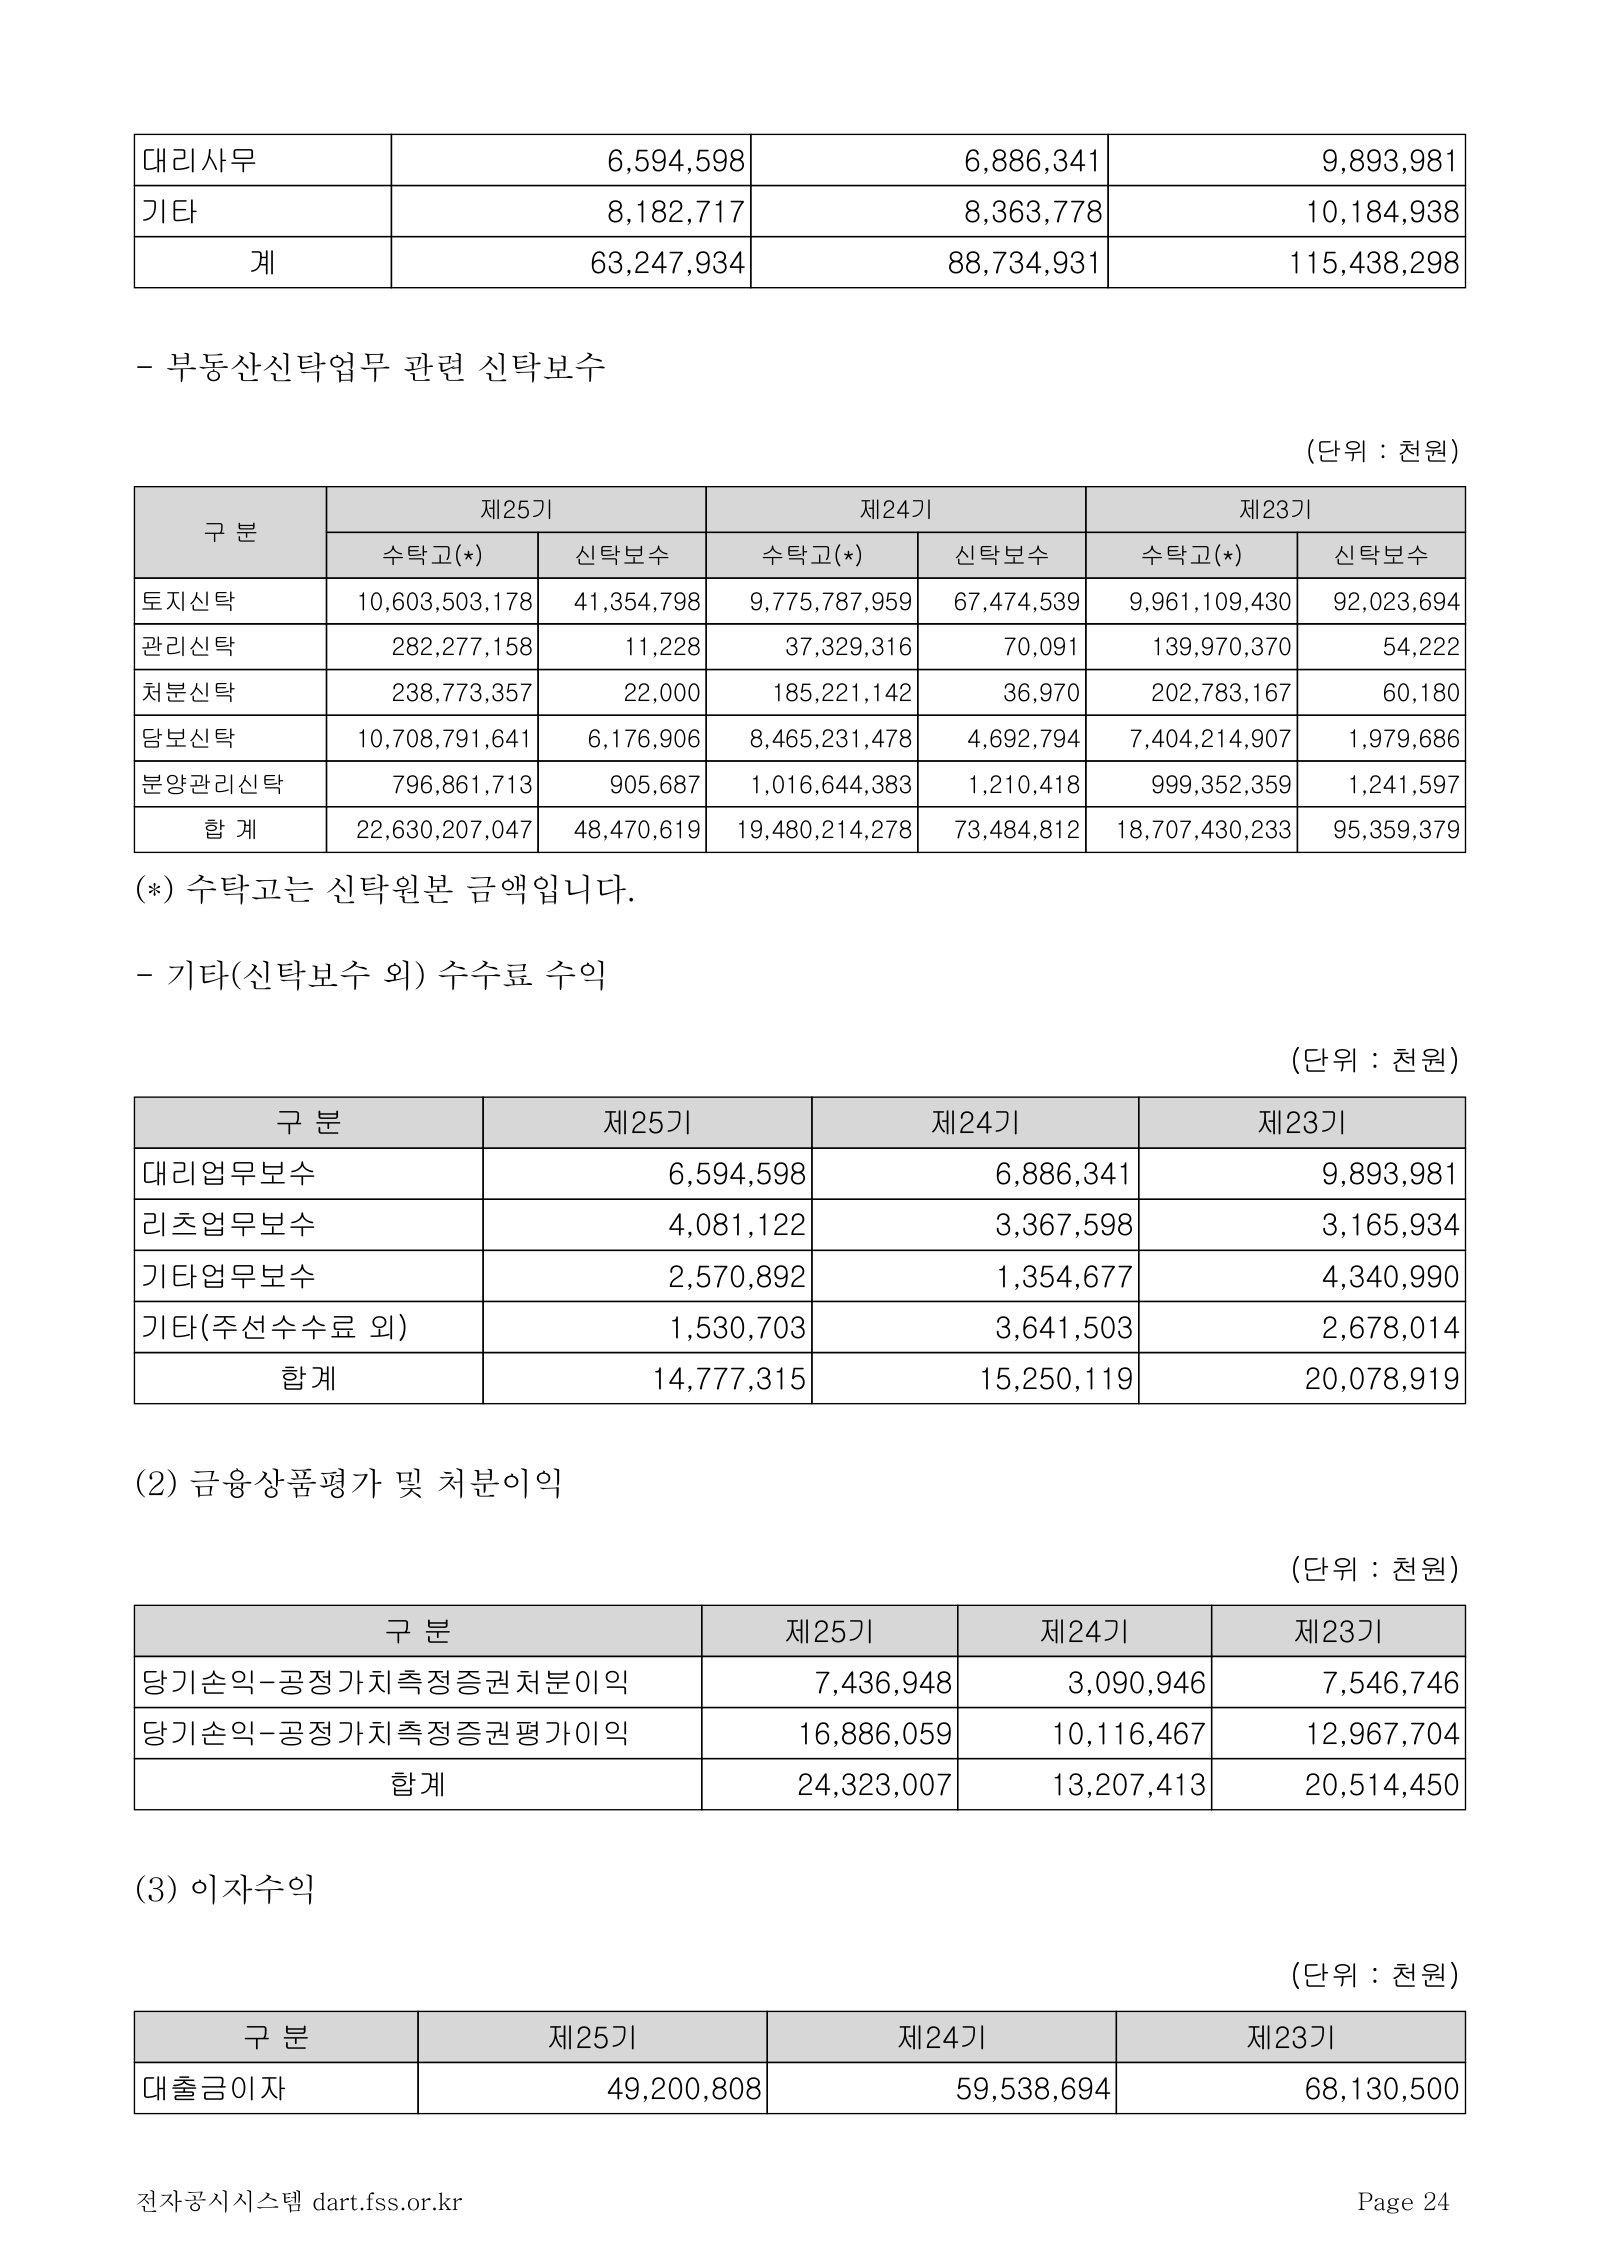
5. 재무건전성 등 기타 참고사항 — p. 30 · Read the full section →
The regulator's own lenses on a trust company: net operating capital ratio, won liquidity, and the classified-asset table.
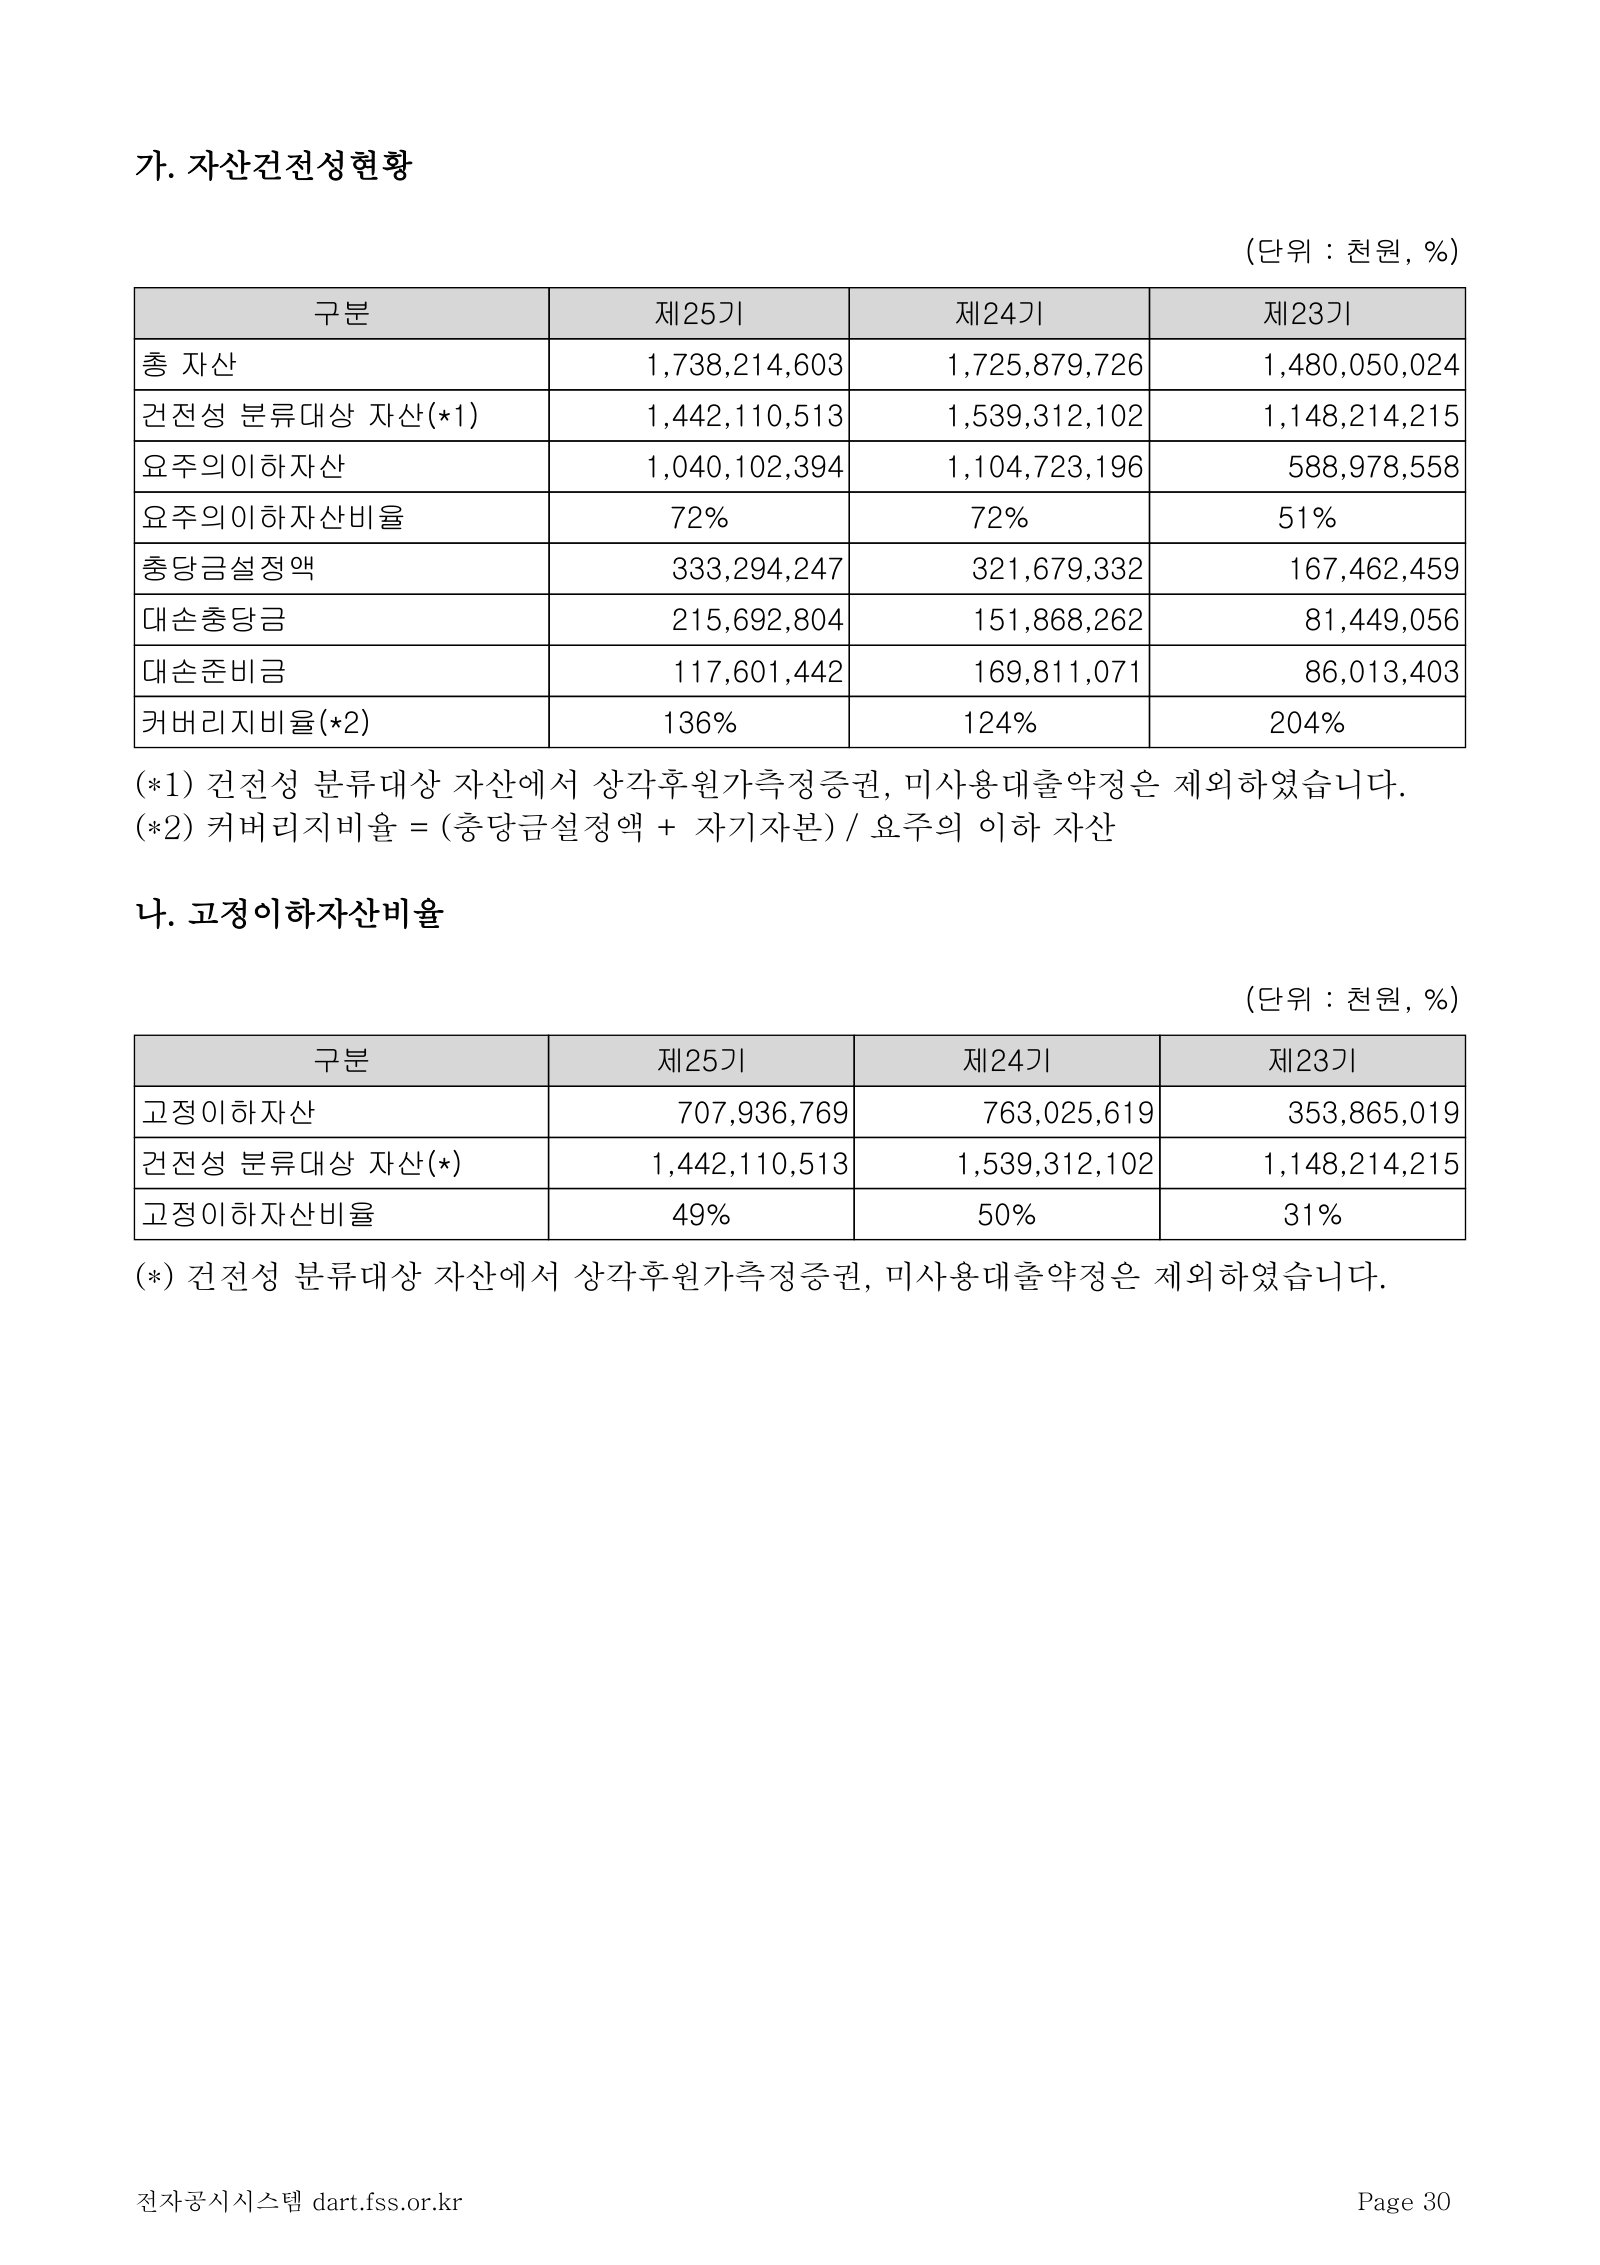
재무제표 주석 · 3. 중요한 회계정책 (수익인식) — p. 126 · Read the full section →
The policy that defines the model: land-trust fees are spread straight-line over the trust term, so bookings and revenue are years apart.
Land-trust fee recognition, and the separate performance obligation for responsible-completion duties.
토지신탁은 토지소유자가 토지를 효율적으로 활용하여 수익을 얻을 목적으로 신탁회사에 신탁을 하고 신탁회사는 자금의 조달, 건설, 임대, 분양 등을 수행하는 신탁으로당사의 수행의무는 개발사무관리와 분양사무관리로 각각 식별되나 두 수행의무 모두관련된 보수를 전체신탁기간에 걸쳐 정액법으로 안분하여 수익을 인식하며 기업회계기준서 제1115호 문단 22내지 23에 따라 하나의 수행의무로 식별합니다. 당사가 책임준공의무를 부담하는 관리형토지신탁은 책임준공이행기간과 전체신탁기간이 유의미하게 차이가 날 경우 당사의 책임준공의무와 관련된 보수를 별도로 식별하여 책임준공이행기간에 걸쳐 정액법으로 안분하여 수익으로 인식하고 있습니다.
p. 136 · Read in context →
8. 기타 재무에 관한 사항 · 나. 상각후원가측정금융자산 대손충당금 설정 현황 — p. 200 · Read the full section →
Shows exactly where the credit risk sits — trust-account advances (신탁계정대) are the single largest receivable and carry a 20% allowance.
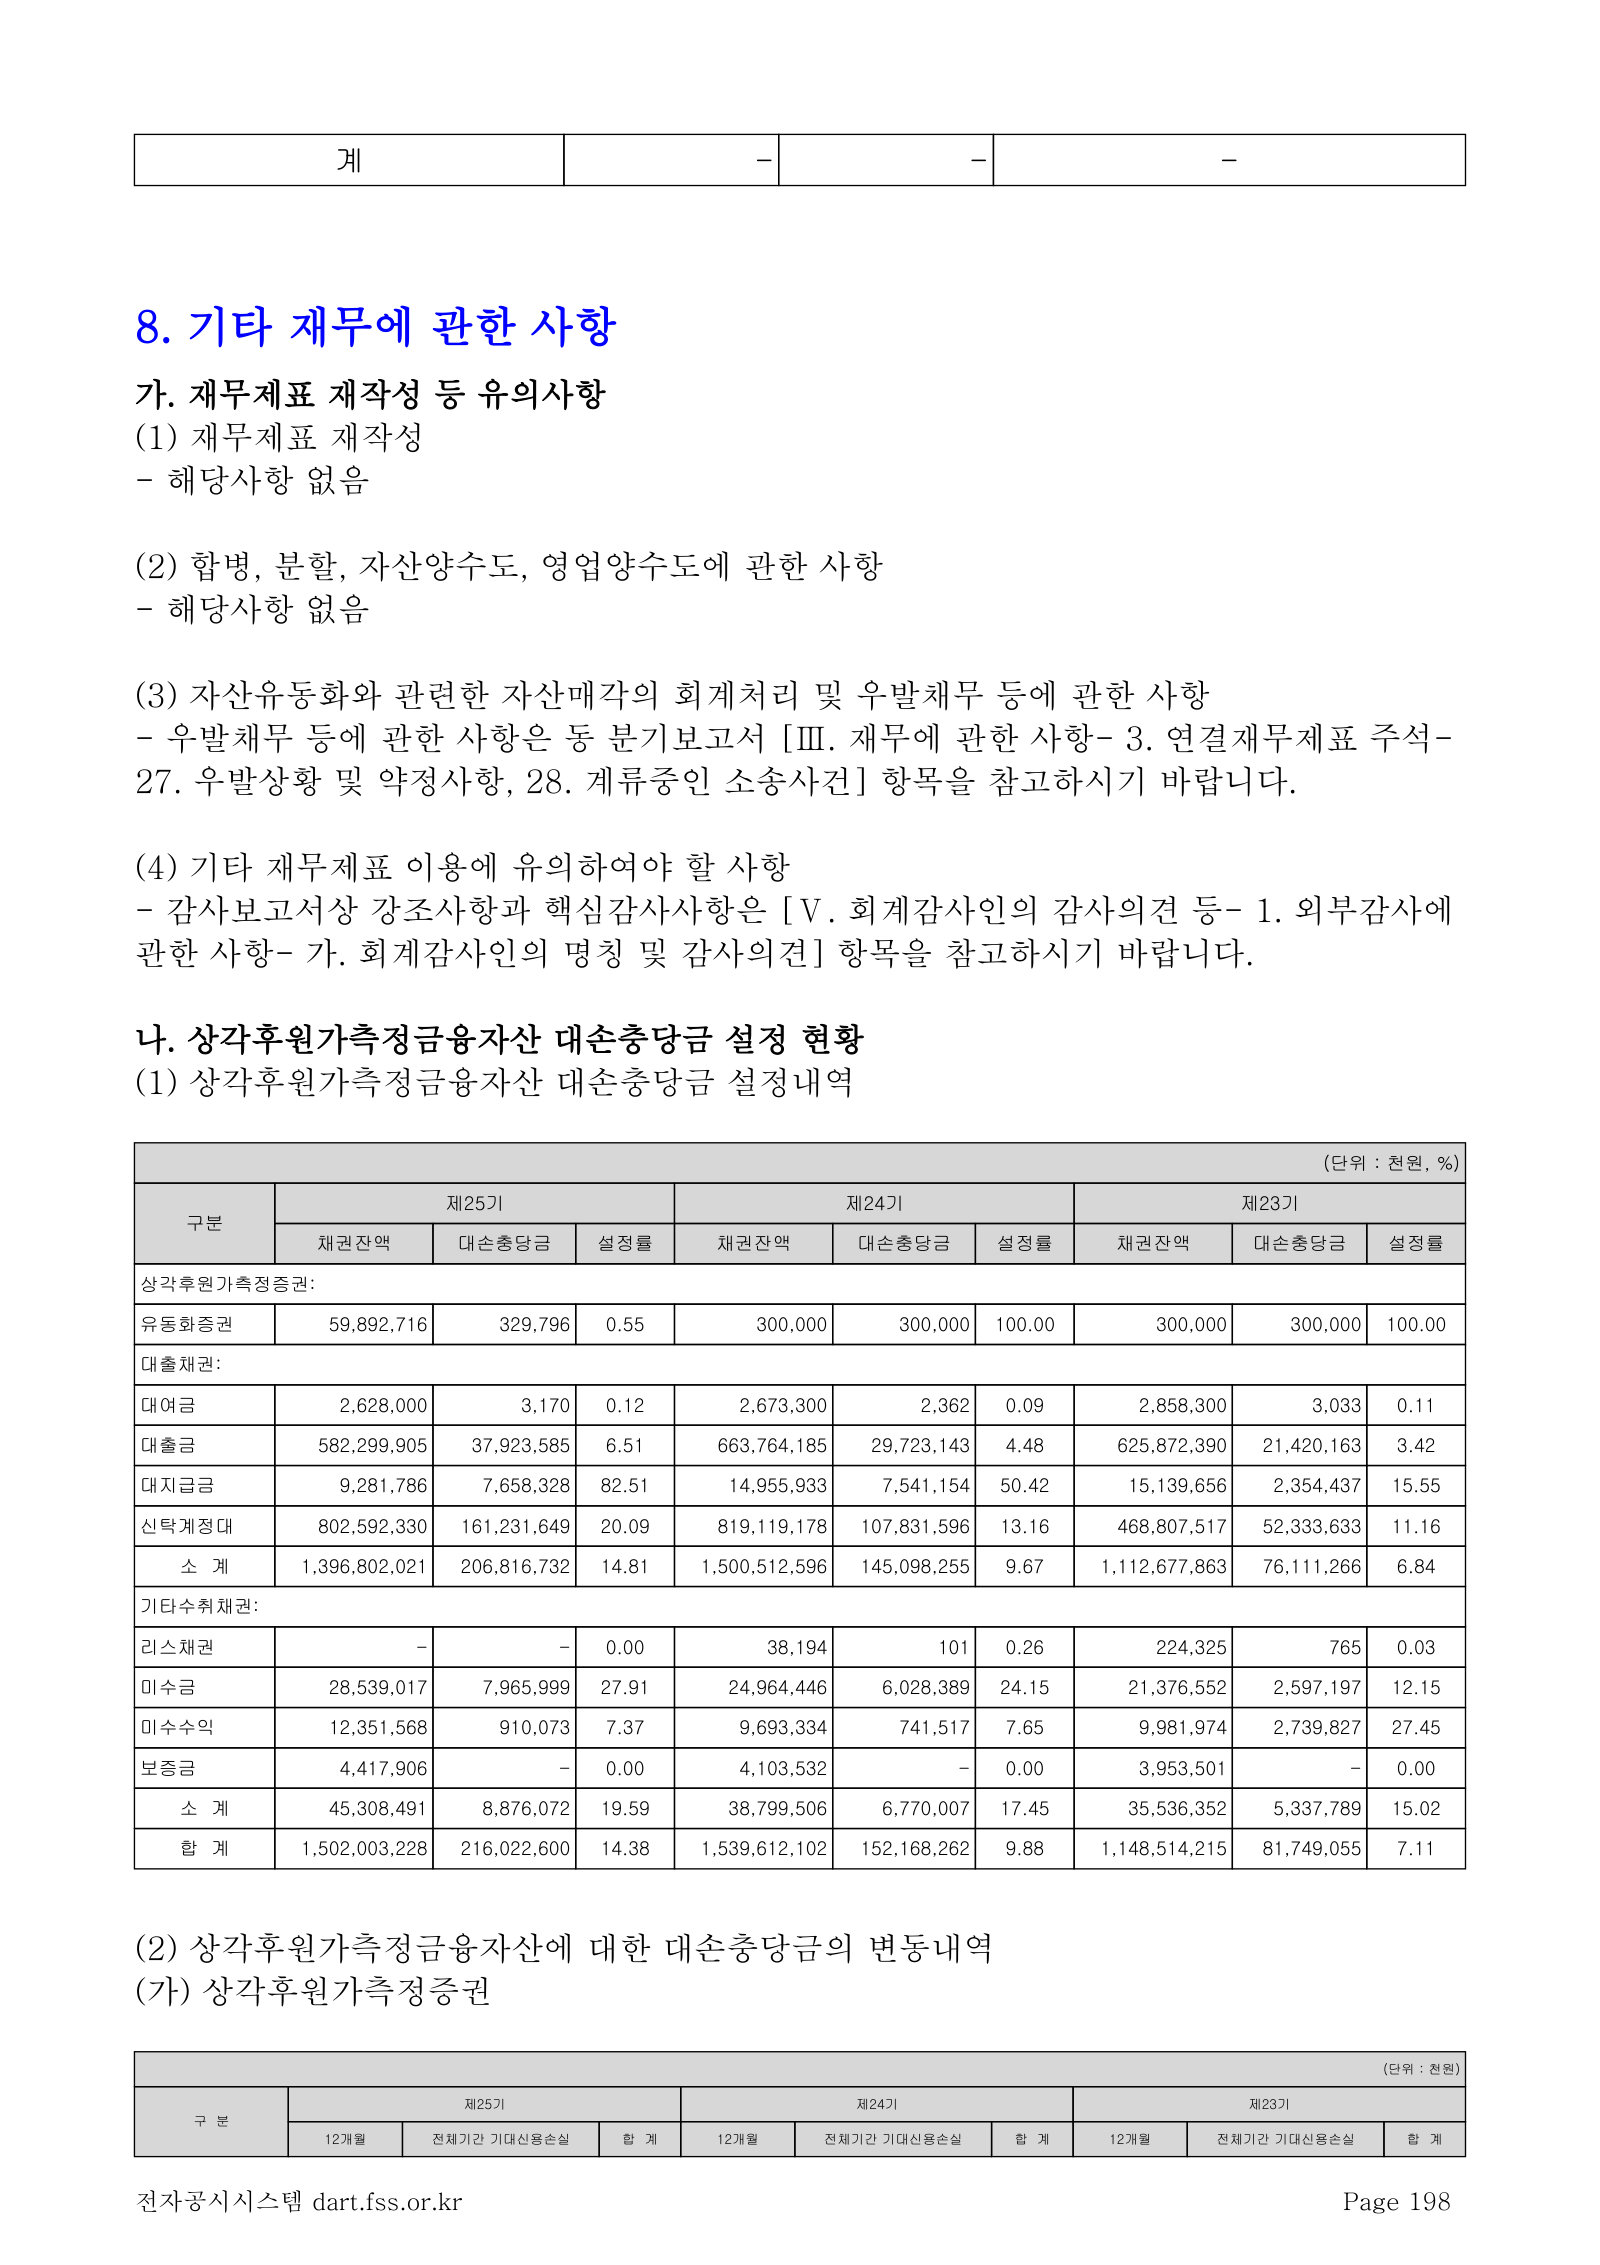
IV. 이사의 경영진단 및 분석의견 · 2. 개요 — p. 208 · Read the full section →
Management's read on why 2025 was weak — provincial concentration, delayed pre-sales — plus the reserve-adjusted ROE it wants judged on.
Operating profit down on lower land-trust bookings and provisions; adjusted ROE of 9.51% on a separate basis.
당사의 2025년 영업이익은 토지신탁 부문의 신규 수주 감소 및 기존 토지신탁 사업장의 손실충당금 반영 등의 영향으로 전년 대비 감소하였습니다. 거시적으로 수도권 부동산 시장은점진적인 회복세를 보인 반면, 당사의 주요 사업장이 집중된 비수도권 지역은 높은 미분양주택 비중이 지속되는 등 지역 간 부동산 경기의 양극화가 심화되었습니다. 이러한 외부 환경 요인으로 인해 일부 사업장의 분양 지연 및 사업성 저하가 발생하였고, 이는 당사의 전반적인 수익성 하락으로 이어졌습니다. […] 아울러, 전 사업장에 대한 정밀 점검을 실시하고 충분한 대손준비금을 적립함으로써 잠재 부실에 대한 손실흡수능력을 크게 높였습니다. 보수적인 리스크 관리 기조하에 대손준비금을반영한 별도 기준 조정 ROE 역시 9.51%를 달성하여, 어려운 환경 속에서도 유의미한 재무적 성과를 시현하였습니다.
p. 208 · Read in context →
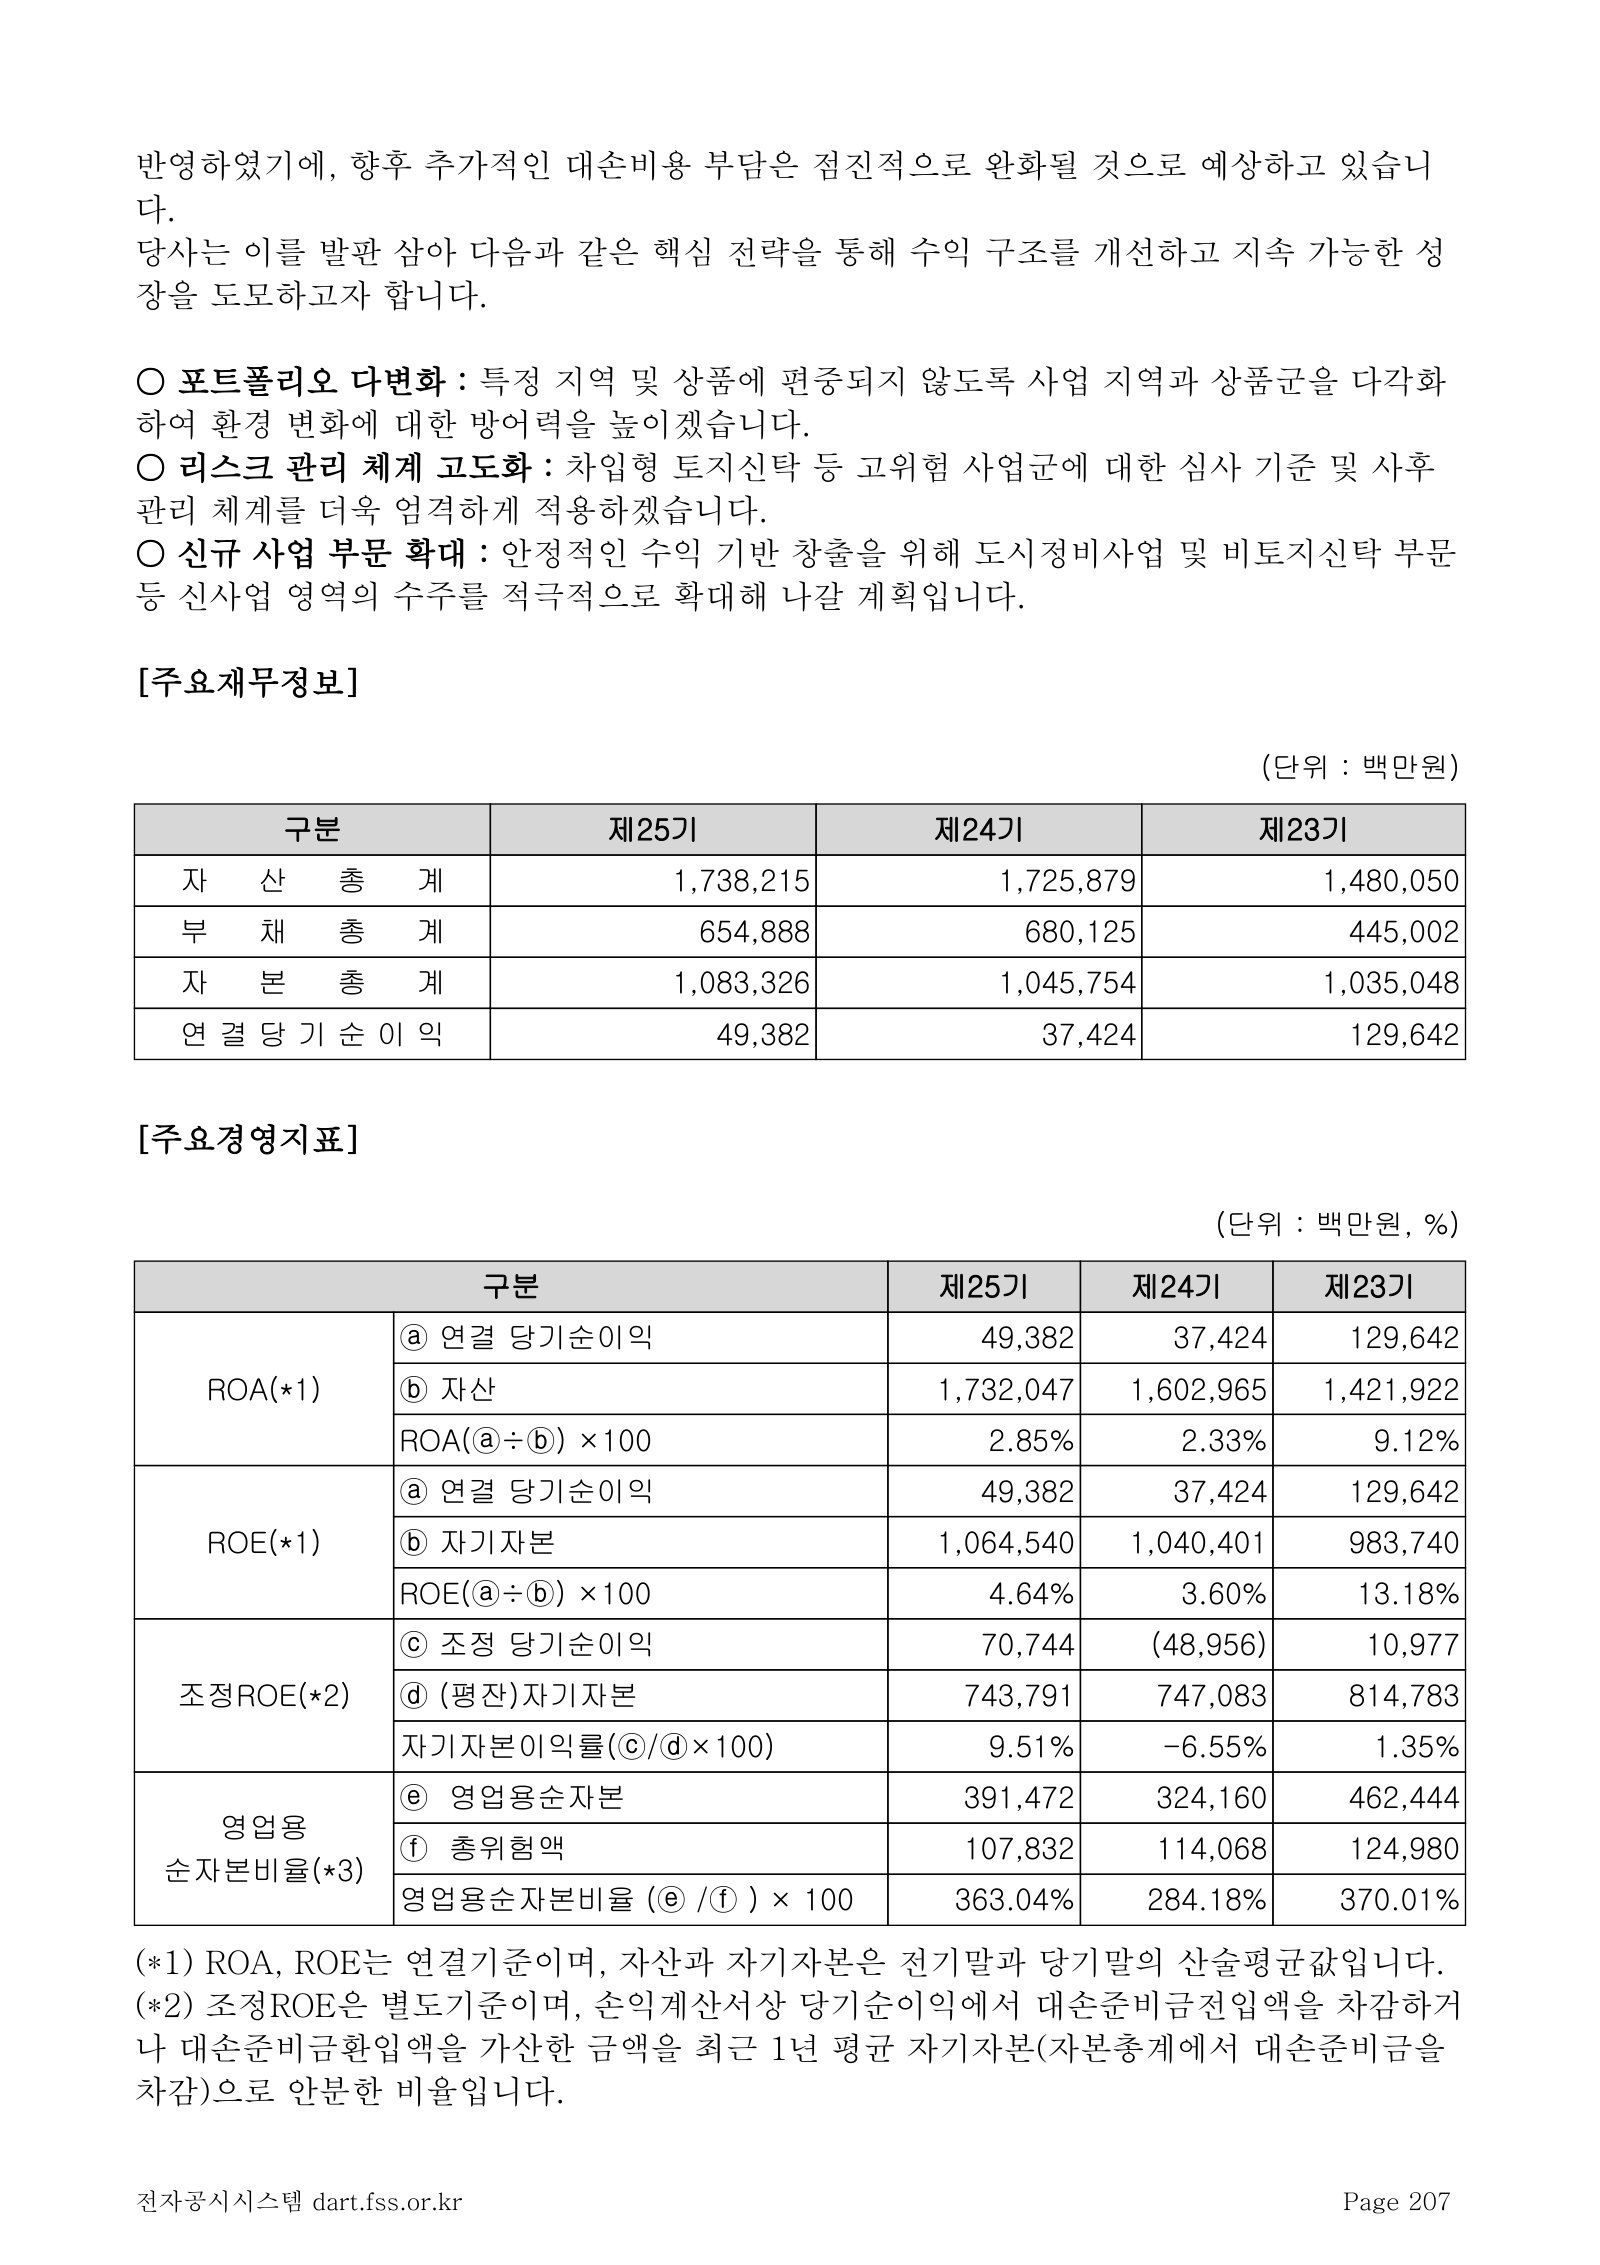
3. 재무상태 및 영업실적 · 다. 사업부문별 영업실적 — p. 211 · Read the full section →
Splits the group into trust and capital: trust operating profit fell 61%, and litigation wins, not operations, carried net income.
Trust segment: fees down, trust-account-advance credit quality worse, and a warning on provincial development trusts in 2026.
2025년 한 해 동안 부동산신탁업계는 부동산 경기 둔화, 프로젝트파이낸싱(PF) 시장 위축,건설원가 상승 등 복합적인 대외 환경 변화 속에서 어려운 경영 여건에 직면하였습니다. 이러한 환경 속에서 부동산 개발사업 착공이 감소하고 일부 사업장의 분양 일정이 지연되면서신탁보수 및 관리보수 등 영업수익이 전년 대비 감소하였으며, 신탁계정대 자산의 건전성 악화로 손실충당금이 확대되었습니다. […] 2026년에도 지정학적 리스크와 부동산 경기 양극화가 지속됨에 따라 업계 전반의 경영 환경은 여전히 순탄치 않을 것으로 예상됩니다. 특히 시장 침체의 여파로 지방 차입형 토지신탁사업의 정리 및 회수가 지연될 가능성이 존재합니다.
p. 211 · Read in context →
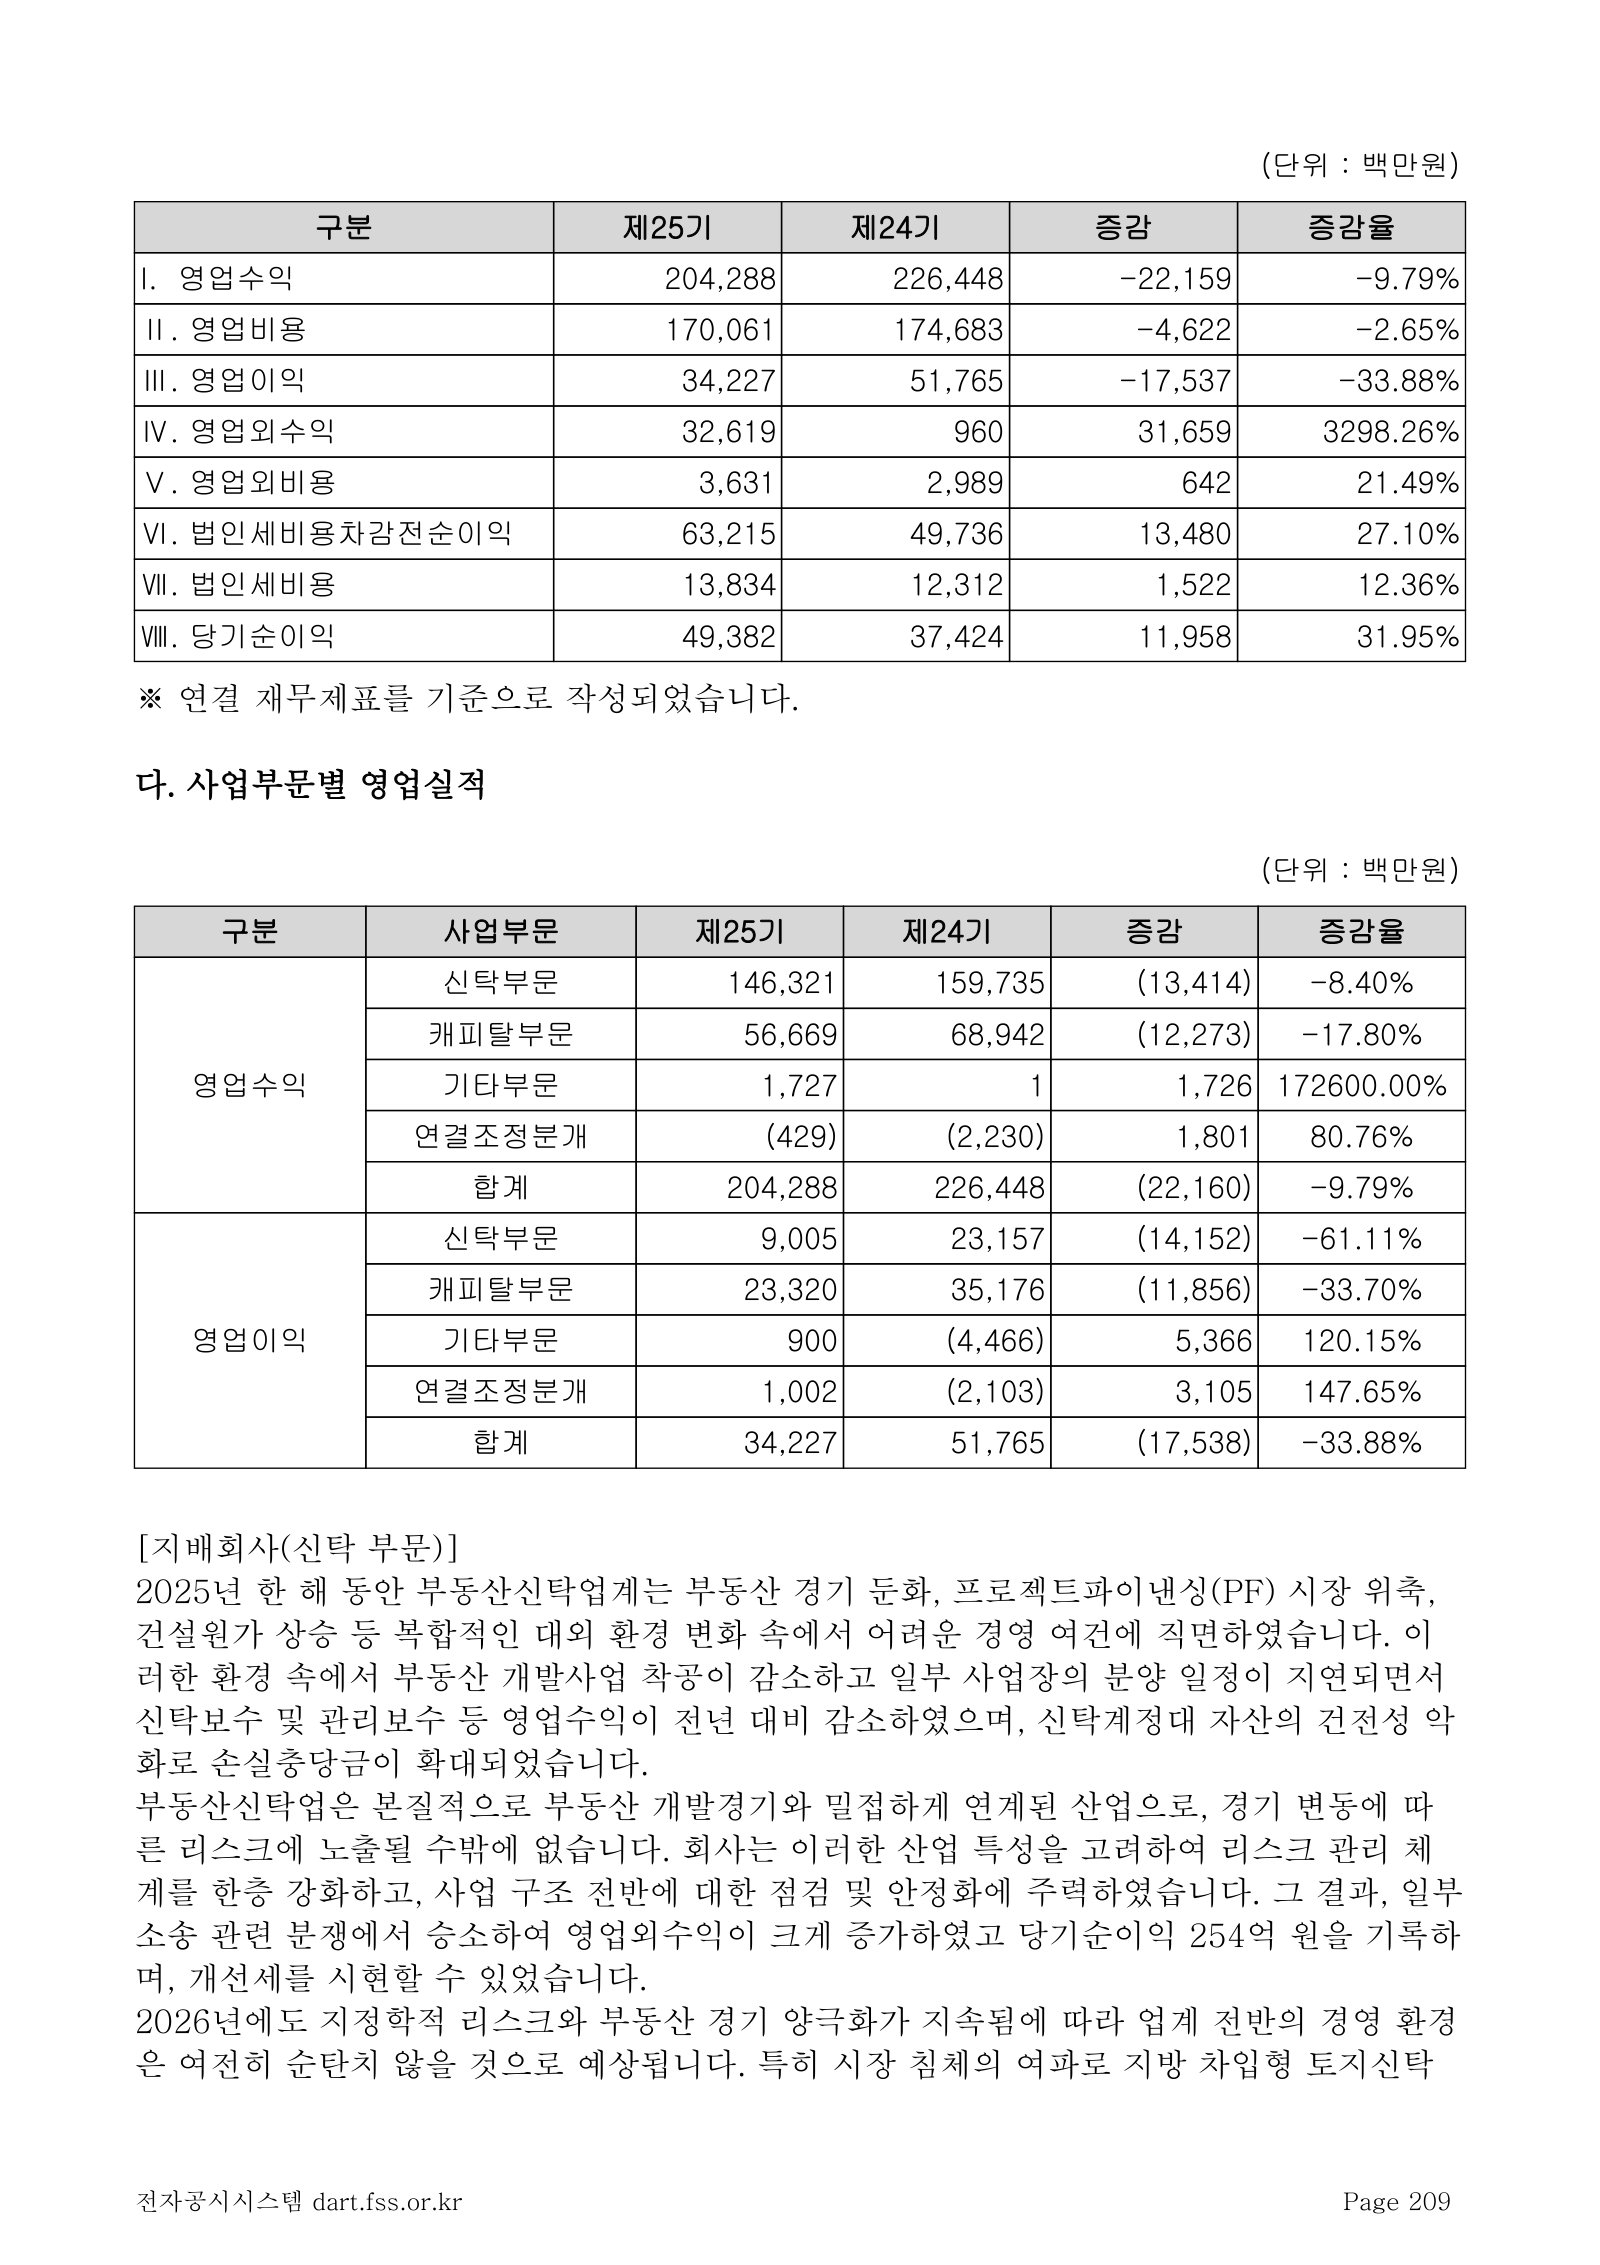
4. 유동성 및 자금조달과 지출 — p. 214 · Read the full section →
A trust company that lends into its own projects has to fund itself — this is the borrowing stack, its cost, and the maturity wall.
Net debt of ₩469.5bn at end-2025 and a lower average funding cost.
2025년말 현재 영업이익 내부유보 및 일반자금대출 한도 증액 등에 따른 충분한 유동성을확보하고 있으며, 보유 현금 및 현금성 자산을 차감한 순차입금은 469,476백만원입니다. 한편, 조달비용의 측면에서는 기준금리 인하 등에 따라 2025년 평균자금 조달금리가 전년 대비 하락하였습니다.
p. 217 · Read in context →
5. 부외거래 · 마. 그 밖의 우발채무 등 — (1) 책임준공 사업장의 리스크 관리 — p. 218 · Read the full section →
The risk that has killed peers: if a contractor misses completion, the trustee owes the lenders. This page sizes what is left of that book.
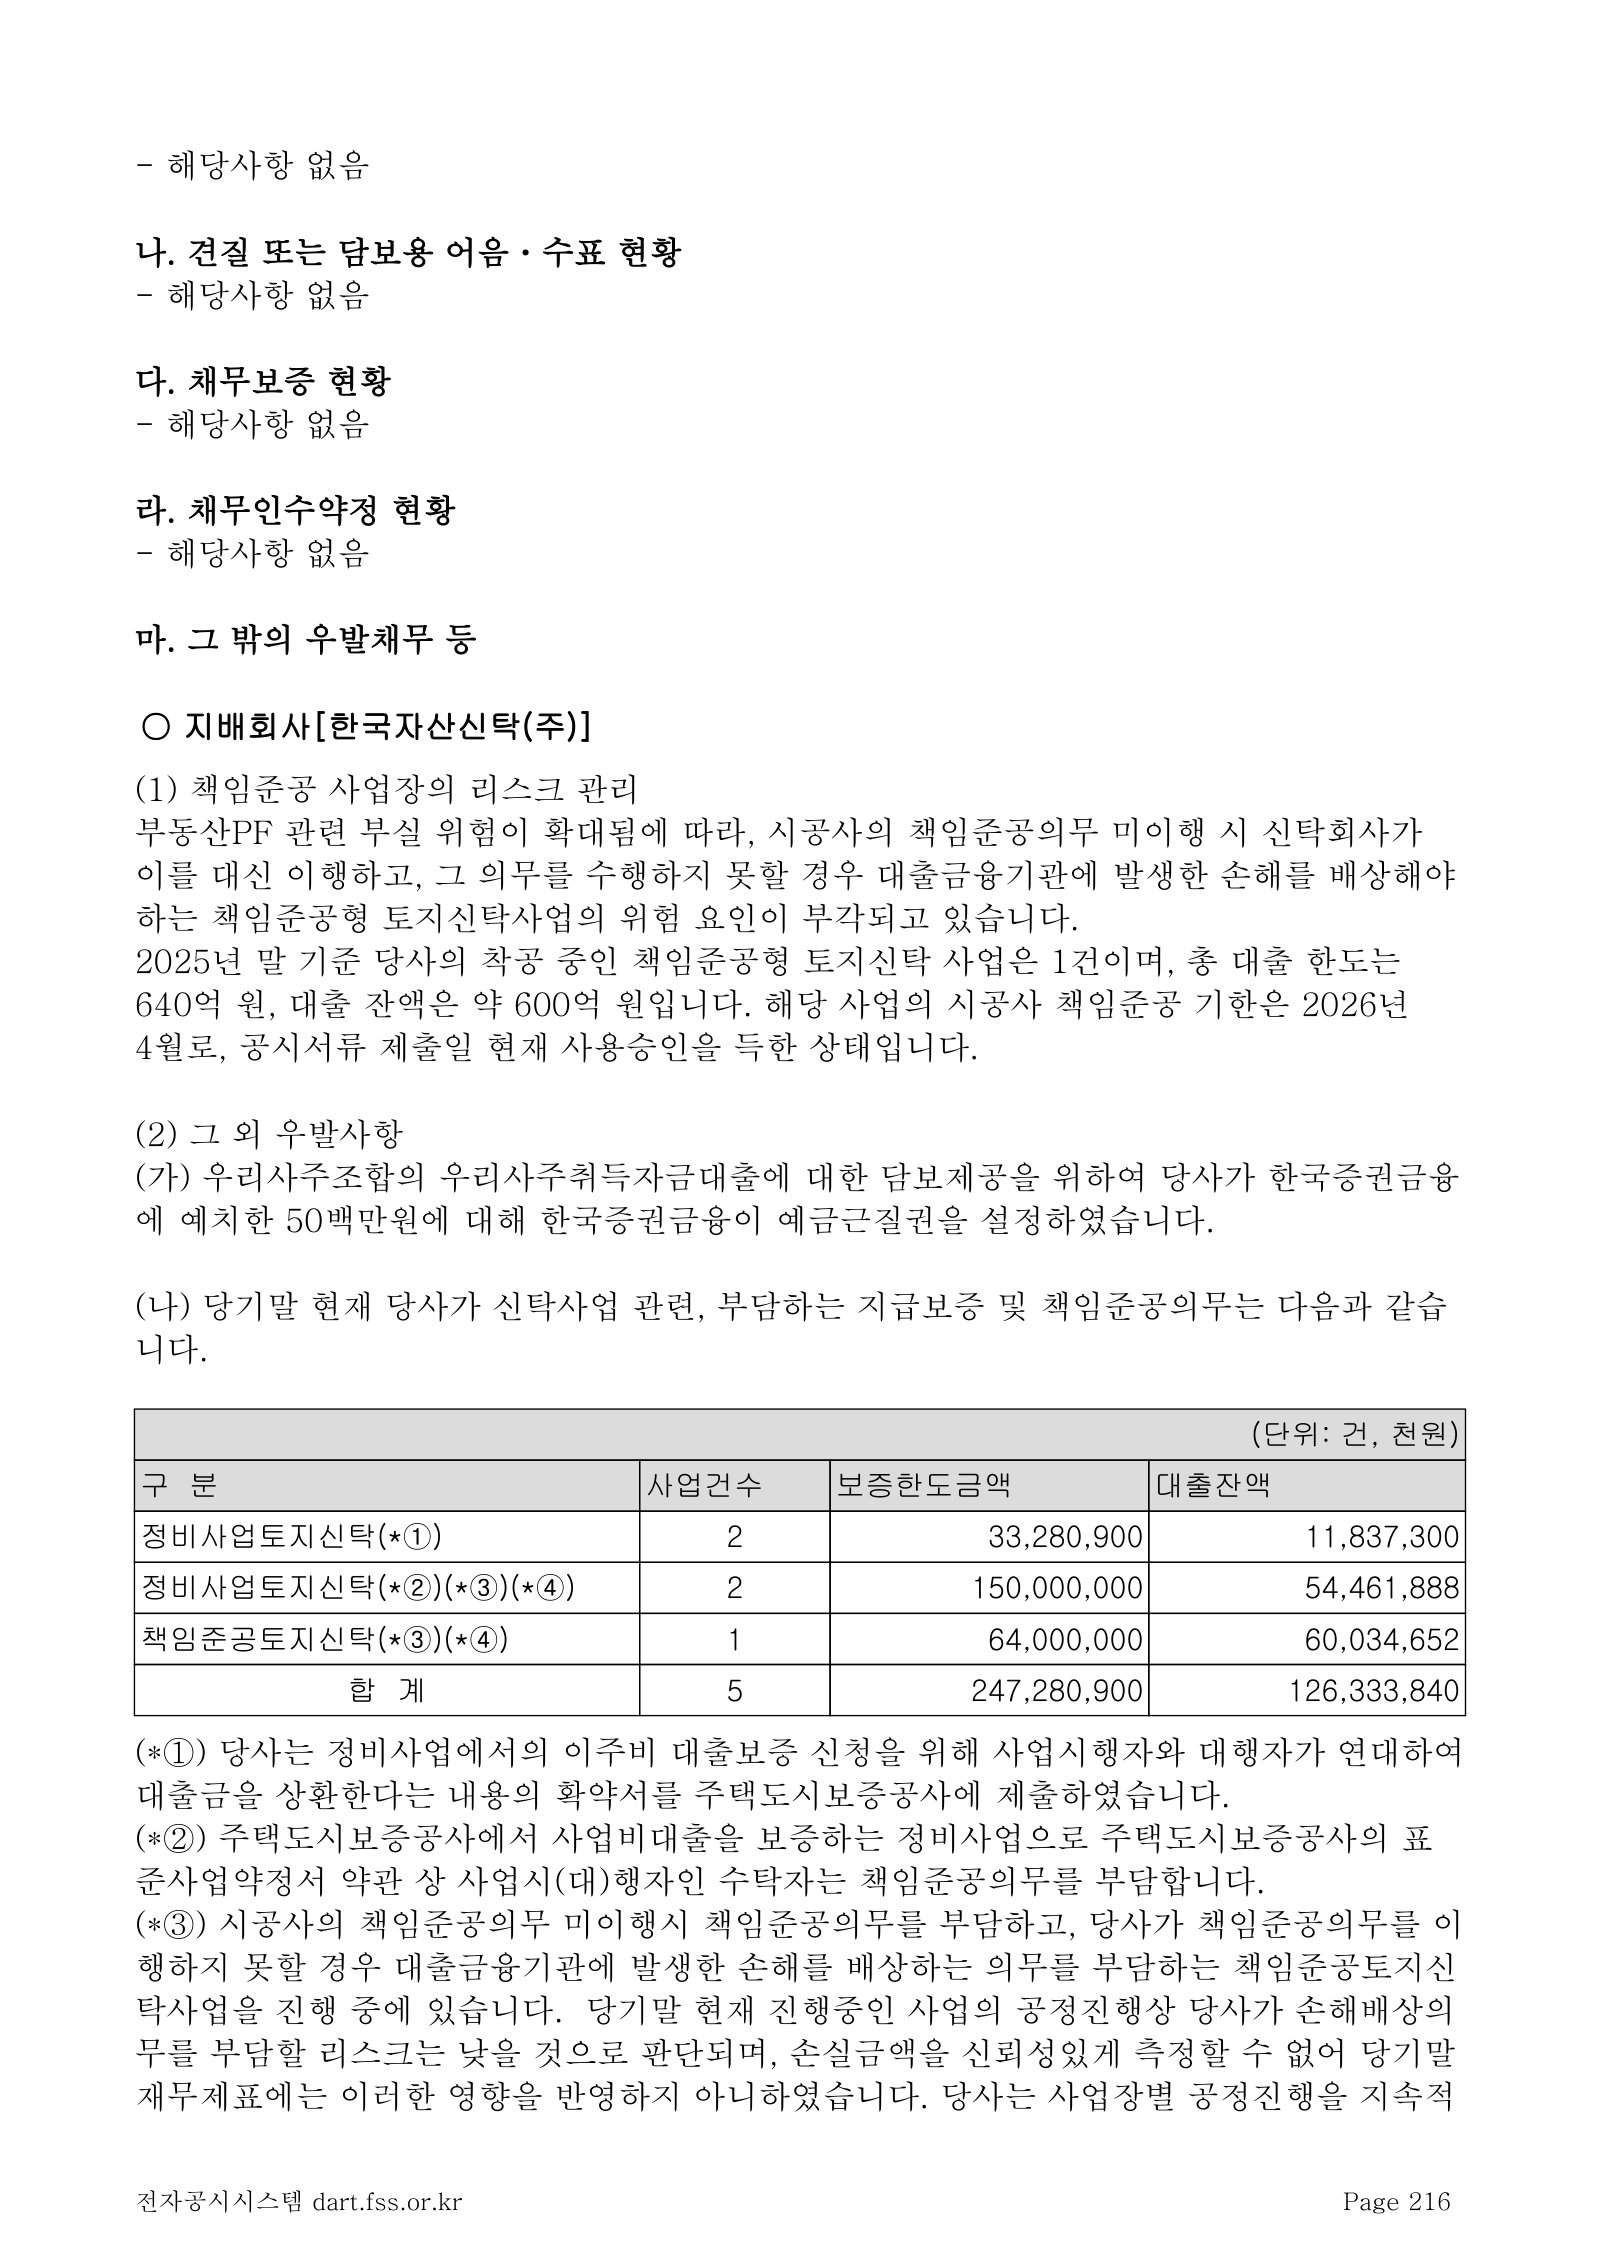
한국자산신탁 — FY2023 사업보고서 (제23기 Annual Business Report) — FY2023
The peak-cycle edition, kept for two sections that changed materially since: the peer market-share table later dropped, and the responsible-completion book at its largest. · Open the full document →
다. 부동산신탁 시장의 규모 및 영업 여건 — (3) 시장 점유율 추이(영업수익) — p. 18 · Read the full section →
A named-peer revenue share table covering all 14 trust companies; the FY2025 report no longer publishes it.
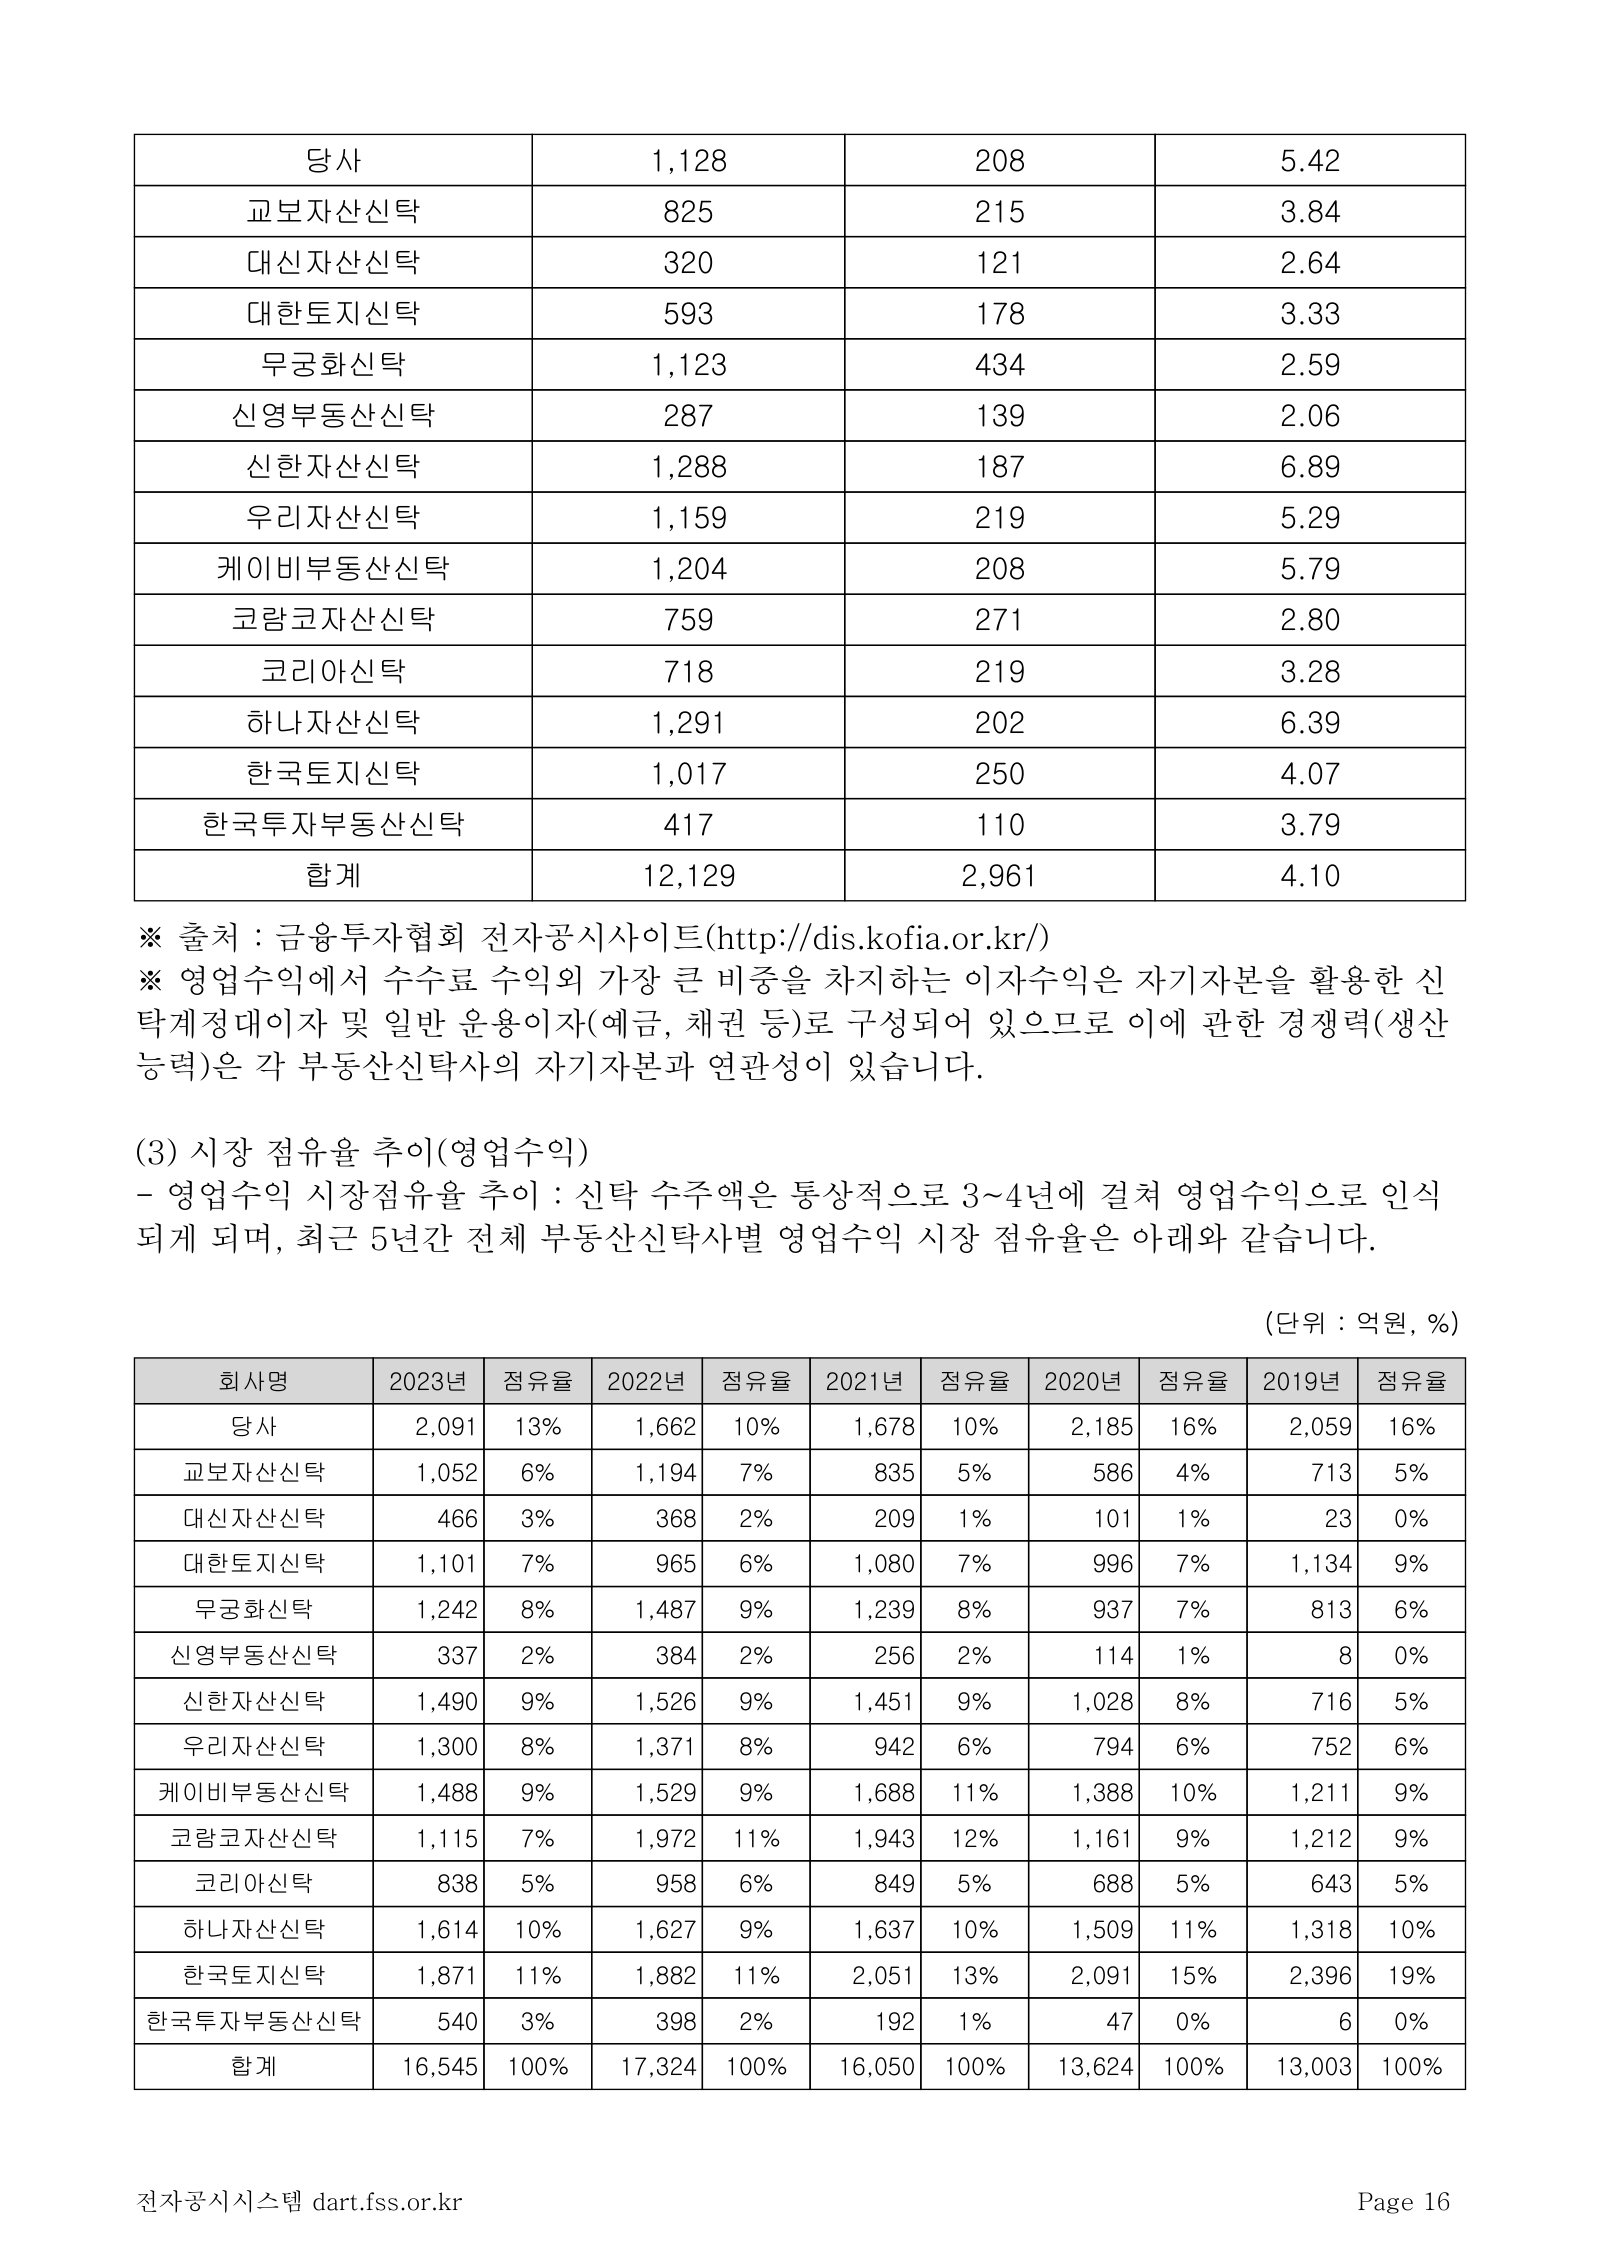
More annual reports
한국자산신탁 — FY2024 사업보고서 (제24기 Annual Business Report) — FY2024 · 331 pages · The year the provisions landed: operating profit down ₩64.9bn and reserve-adjusted ROE negative for the first time. · Open →
한국자산신탁 — FY2022 사업보고서 (제22기 Annual Business Report) — FY2022 · 304 pages · The last pre-stress edition, with the development-trust and responsible-completion books still being written. · Open →
한국자산신탁 — FY2021 사업보고서 (제21기 Annual Business Report) — FY2021 · 293 pages · Earliest edition on the shelf; useful as the cycle baseline before rates turned and PF funding tightened. · Open →
Competitors describe Korea Asset In Trust Co., Ltd.'s market in their own filings and calls. These verified passages and visual pages show where their strategies meet, using source documents preserved in Sources.
한국토지신탁 (Korea Real Estate Investment & Trust, "KOREIT") (034830)
The only other listed pure-play Korean real estate trust company, and the closest thing Korea Asset In Trust has to a mirror. KOREIT holds the same 신탁업 licence from the FSC, sells the same product set - 차입형 and 관리형 토지신탁, 담보신탁, 분양관리신탁, 대리사무 - competes for the same 신탁방식 도시정비 (trust-led redevelopment) mandates, and runs the same kind of REIT AMC alongside it. It was founded in 1996 as a subsidiary of Korea Land Corporation, five years before KAIT, and the two have traded the top of the industry's capital table for years. It matters more than any other document here for a second reason: KOREIT's 사업보고서 is the industry's de facto market-structure report. It reproduces the Korea Financial Investment Association data for all fourteen licensed trust companies - equity, net income, operating revenue, market share - with 한국자산신탁 named in every table. A KAIT reader gets the subject's own share, computed and published by its nearest rival.
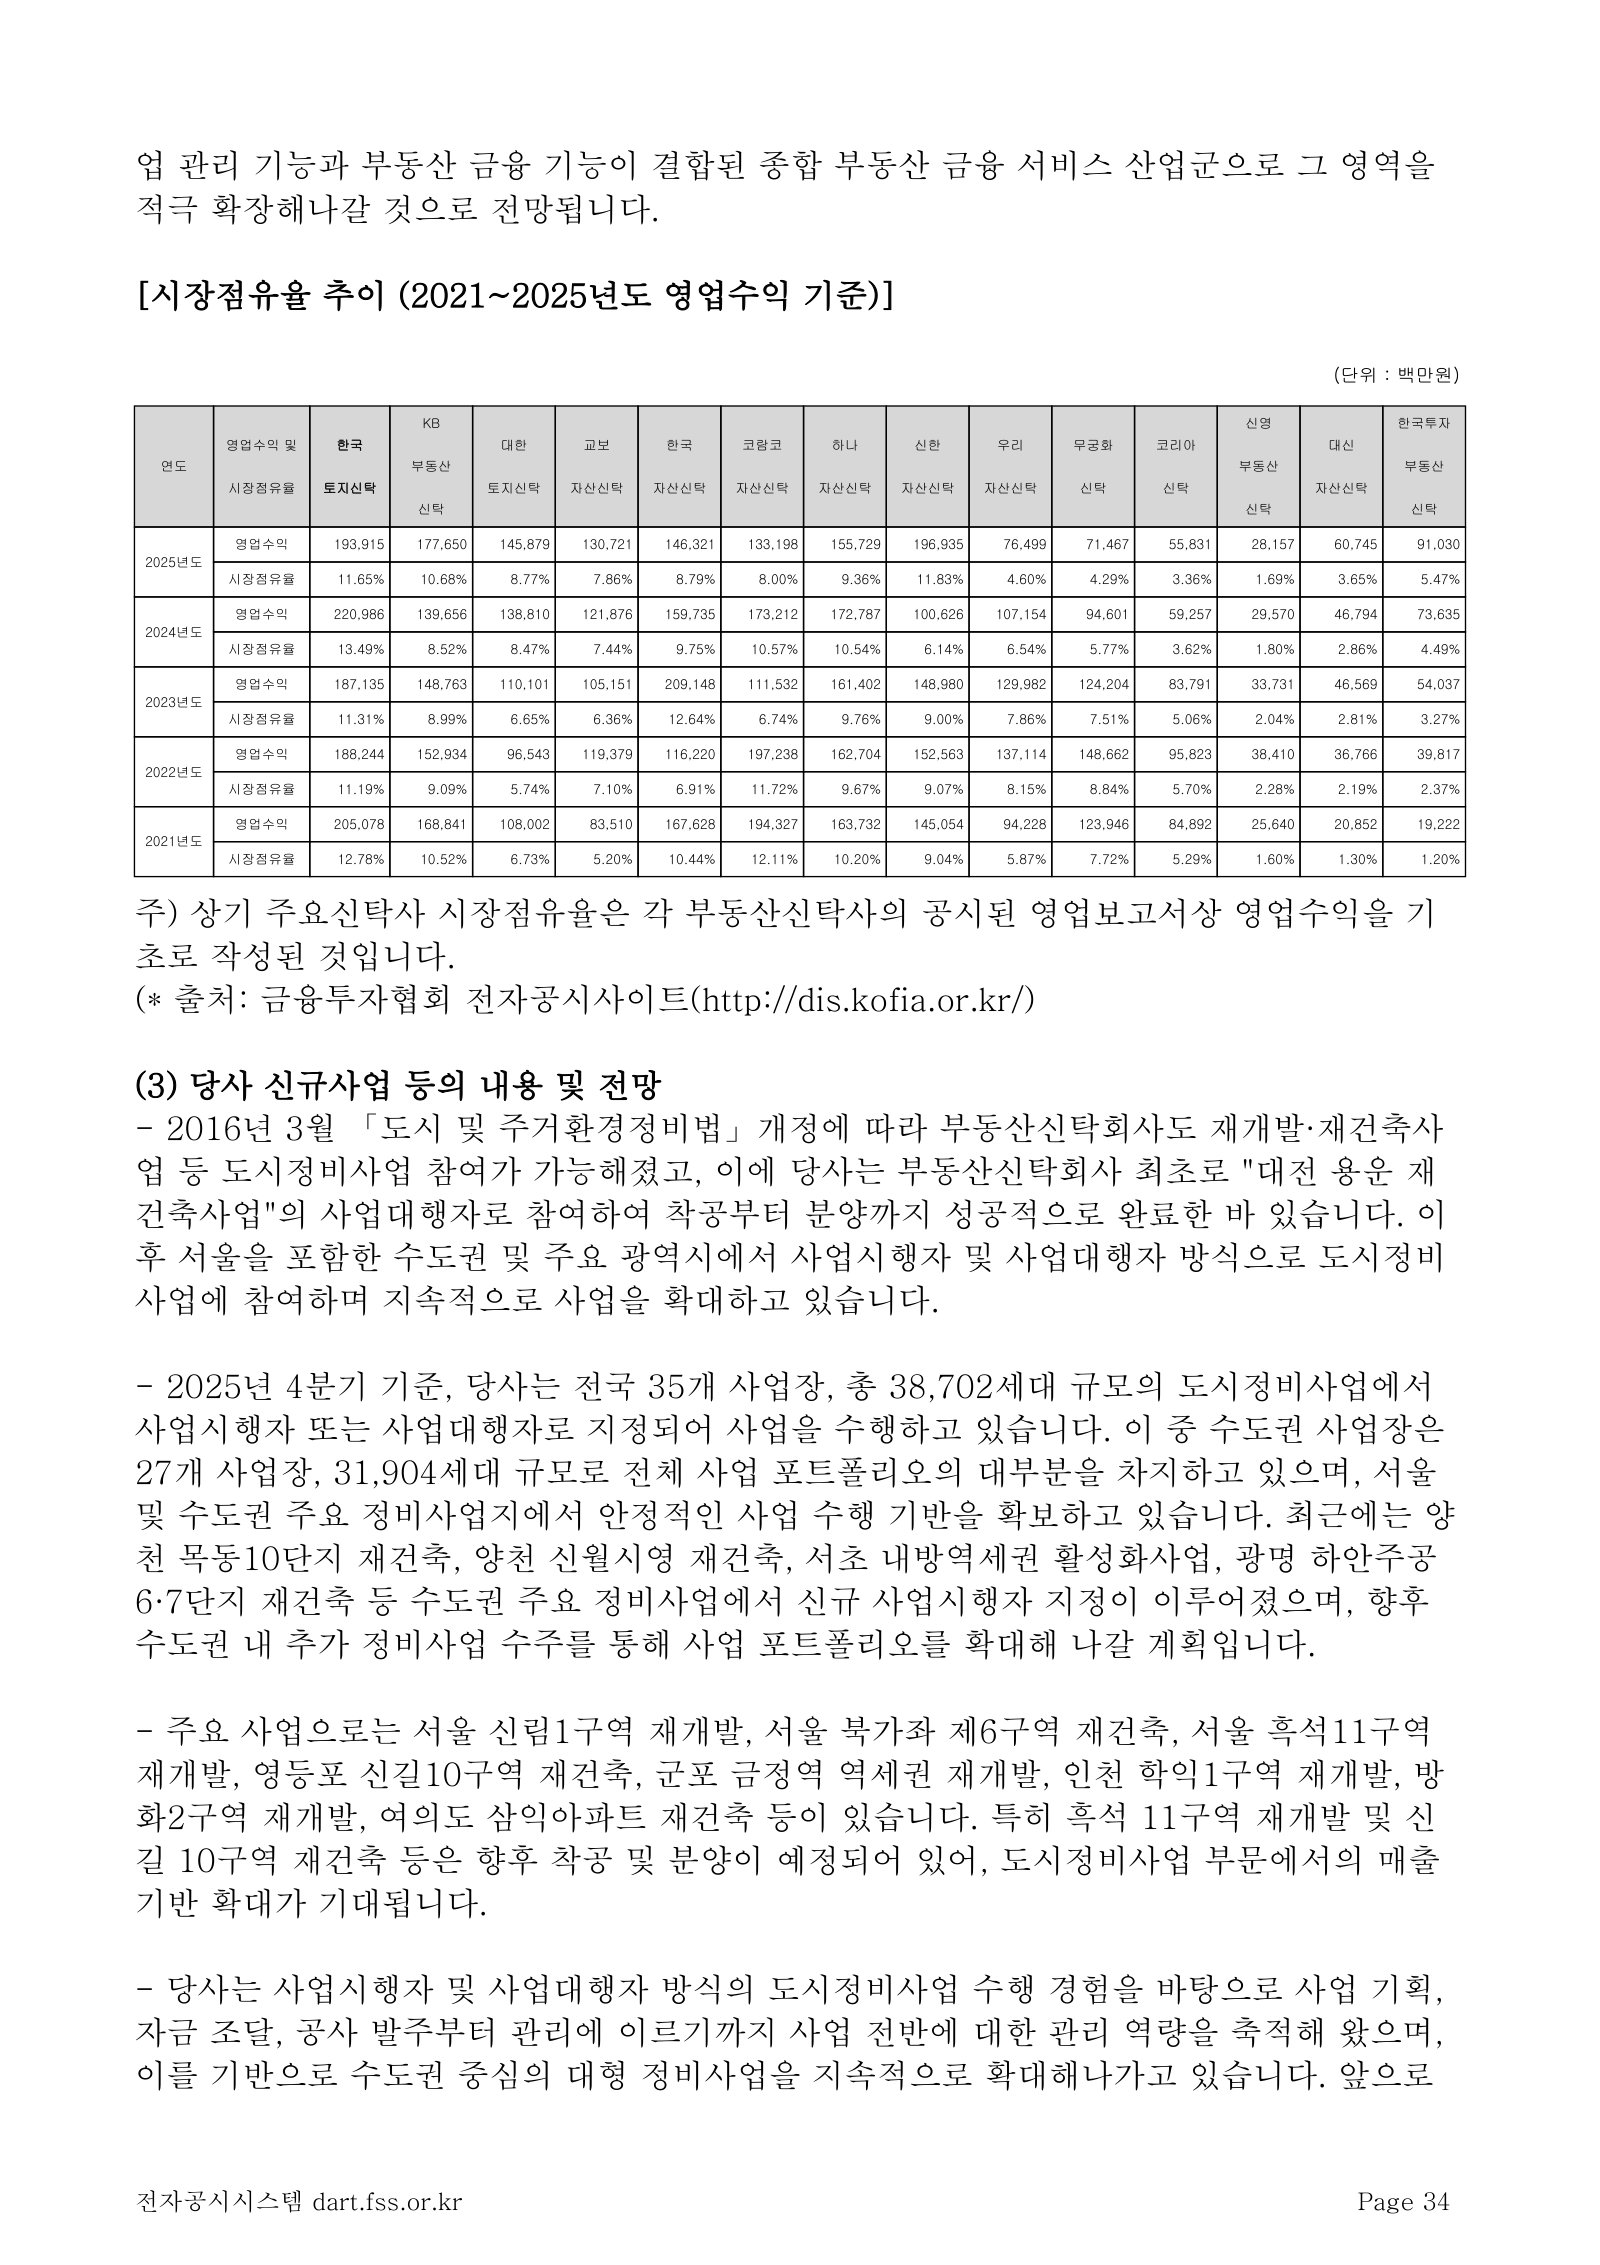
코람코자산신탁 (Koramco Asset Trust), disclosed within LF Corp (093050)
Koramco Asset Trust is one of the fourteen licensed Korean real estate trust companies and, on 2025 operating revenue of KRW133.2bn, ranks seventh of the fourteen, two places below the subject. It is the peer whose shape is closest to what KAIT says it is becoming: a trust licence bolted onto a REIT asset-management franchise, with a captive fund manager (코람코자산운용) alongside. It is also the clearest case of a competitor publicly walking away from the business KAIT still leads with - its filing states plainly that it is rebuilding its trust portfolio away from 차입형토지신탁. Koramco is not separately listed; it is consolidated by LF Corp, the fashion group, whose 사업보고서 carries Koramco's standalone business section. Only that section is used here - LF's apparel brands, Maison Kitsune, Max Mara and the rest are set aside as irrelevant to the subject.
Koramco Asset Trust's self-assessment, from the Koramco business section of LF Corp's FY2025 사업보고서 (p.52). Two claims matter to a KAIT reader. First, Koramco describes itself as holding an 과점적 시장지위 - an oligopolistic market position - in REIT asset management for office and retail assets, which is its own characterisation and carries no supporting share figure in the filing. Second, and more concretely, it says it is restructuring its trust portfolio away from a 차입형토지신탁 core toward urban-regeneration work and non-land trusts, and rebuilding its business base for stability. That is a direct strategic divergence: the subject's FY2025 filing still shows about KRW2.2tn of 차입형 land trust inside KRW22.6tn of total assets under trust, and books roughly 60% of its new fee commitments there. One competitor is deliberately reducing the exposure the subject is still writing.
2006년 3월 당사는 부동산신탁업 본인가를 취득하여 리츠 자산관리와 더불어 부동산신탁업 을 겸영함으로써 주택 개발 등의 토지신탁 사업과 분양관리신탁, 대리사무 등의 비토지 상품 들을 수주하여 부동산신탁사업영역을 확대해 왔습니다. […] 나. 당사의 강점 및 단점 당사는 우수한 운용 성과와 영업 네트워크에 기반해 REITs 설립·운용의 전 과정에서 차별적 인 사업 경쟁력을 시현하며 REITs AMC로서 우수한 시장지위가 유지되고 있습니다. 특히, 오피스·리테일 자산을 취급하는 REITs AMC부문에서 과점적 시장지위를 확보하고 있으며, 신규 REITs 설립을 통해 최상위의 영업력을 유지하고 있습니다. 부동산신탁업 또한 부동산 산업에 대한 높은 이해도와 전문성을 갖춘 전문 인력을 바탕으로 운영하는 중입니다. 신탁사업 사업포트폴리오를 기존 차입형토지신탁 중심에서 도시재생사 업, 비토지신탁 등 비차입형 토지신탁을 중심으로 개편하고 있으며, 수익과 안정적인 운영을 위한 사업기반을 재구축하고 있습니다.
p. 52 · Read in context →
Koramco's revenue by product line and its assets under trust, three years, from LF Corp's FY2025 사업보고서 (p.59); columns run 2025 / 2024 / 2023 throughout and amounts are KRW millions. The first block is the foot of the revenue-by-line table that begins on p.58, so its 자산관리 수수료 and 토지신탁 rows sit on the previous page; the total is what matters - KRW82.2bn in 2025 against KRW141.3bn in 2024. Essentially all of the swing is the REIT asset-management fee line reproduced beneath it, KRW58.2bn against KRW119.2bn, which is transaction-driven (acquisition and disposition fees) rather than recurring. The trust table underneath shows the structural point: assets under trust grew to KRW17.5tn from KRW8.9tn in 2023, but the fee take on them fell to KRW17.8bn from KRW19.1bn. Almost all the growth is 담보신탁 - collateral trust - at KRW12.8tn of trust principal earning KRW6.0bn, while 토지신탁 at KRW2.7tn earned KRW10.1bn. That is the ratio that explains why assets under trust is a poor proxy for revenue in this industry, and it is worth holding against the subject's headline KRW22.6tn: the mix inside the number does more work than the number.
관리신탁 132 126 61 처분신탁 872 272 64 담보신탁 5,957 4,103 3,873 분양관리신탁 461 215 190 기타 348 173 179 대리사무 6,229 5,064 3,585 합계 82,242 141,325 75,853 […] 자산관리 수수료 58,170 119,187 53,172 […] 토지신탁 2,659,370 10,073 2,292,043 12,185 2,234,797 14,729 관리신탁 477,624 132 190,106 126 279,846 61 처분신탁 836,640 872 442,899 272 446,489 64 담보신탁 12,777,315 5,957 10,445,901 4,103 5,533,083 3,873 분양관리신탁 791,180 461 811,360 215 407,403 190 기타보수 - 348 - 173 - 179 합계 17,542,129 17,843 14,182,309 17,074 8,901,618 19,096
p. 59 · Read in context →
Koramco's published fee card for REIT asset management, from LF Corp's FY2025 사업보고서 (p.55): 0.5%-1.0% of the purchase price on acquisition, 0.1%-0.3% of assets under management annually, 0.5%-1.0% of the sale price as a base disposition fee, and a performance fee of 10.0%-20.0% of the disposition gain. These are stated ranges, not realised rates, and the filing gives no indication of where inside them Koramco actually prices. They are still the most concrete public benchmark available for the economics of the Korean REIT AMC business, which is one of the ancillary lines the subject runs alongside its trust licence (KAIT holds both REITs AMC and PFV AMC mandates). The shape of the schedule also explains Koramco's own revenue volatility in the exhibit above: two of the four fee events happen only when an asset is bought or sold.
1) 리츠(REITs) 자산관리회사(AMC) 업무 다수의 투자자로부터 자금을 모집하여 부동산 또는 부동산과 관련된 유가증권에 투자·운용 하여 발생한 수익을 투자자들에게 배당하는 부동산 간접투자방식입니다. […] <보수산정기준> 수수료 구분 기준가액 보수율 비고 매입 매입가 0.5% ~ 1.0% 매입시점 수취 운영 운영자산 0.1% ~ 0.3% 연간 수취 매각 기본 매각가액 0.5% ~ 1.0% 매각시점 수취 매각 성과 매각차익 10.0% ~ 20.0% 기타 - - 자문 수수료 등
p. 55 · Read in context →
하나금융지주 (Hana Financial Group) (086790)
Hana Financial Group owns 하나자산신탁 (Hana Asset Trust), which on 2025 operating revenue of KRW155.7bn and 9.36% share ranks just above the subject in the industry table, and which KAIT's own filing shows as the most fee-productive trust company in Korea after KB - KRW104.1bn of fee income from 193 staff. Only the trust-adjacent parts of these calls are used: Hana's banking, cards, securities and insurance businesses do not compete with the subject. What the transcripts give that no annual report does is a lender's running commentary on the real-estate project-finance cycle that sets the subject's environment - the same PF market whose contraction drives 신탁계정대 recoveries, developer defaults and the pace at which new development trusts get written. Hana is also the only peer here that holds live earnings calls with analyst Q&A.
The most recent read available in this document set: Hana's Group CRO on the Q1 2026 call, 24 April 2026, identifying alternative investments and real estate project financing as what group credit cost actually consists of. Less of it was recognised in Q1, which flattered the quarter, and he expects more in Q2, with full-year guidance of a mid-30bp credit cost ratio. Six months after the Q3 2025 comment above, the real-estate PF clean-up is still the swing item in a major Korean financial group's provisioning - a useful check on any assumption that the development-credit cycle the subject operates in has already turned.
['Jae Shin Kang (Group CRO, Hana Financial Group)']: And then, usually, when we talk about credit cost, it is about alternative investments or real estate project financing. We had less of that recognized in Q1 which was a positive factor in credit cost in Q1. We do see that they could increase in Q2. So, our plan until end of this year is mid-30 bp credit cost ratio, that's our guidance.
p. 6 · Read in context →
SK디앤디 (SK D&D) (210980)
SK D&D competes with the subject on two fronts rather than head to head across the whole business. Its subsidiary 디앤디인베스트먼트 is a REIT asset-management company licensed under the same 부동산투자회사법 as KAIT's REITs AMC, and it claims the number-one position in Korea by residential AUM. And as a developer that originates, funds and sells its own projects through REITs and funds, it is the alternative route for exactly the sponsors a trust company wants as 위탁자 - a developer who can assemble the site, the capital and the exit in-house has less need to hand the project to a 차입형 trust. Its filing is also the best sizing in this document set of the institutional rental-housing market (기업형 임대주택), which the subject names as one of its stated expansion areas. Its furniture business and the demerged renewables arm are set aside.
SK D&D's description of its REIT asset manager, from its FY2025 사업보고서 (p.28). D&D Investment claims cumulative AUM of KRW5tn including KRW1.6tn of residential assets, and states it holds the number-one position in Korea by residential asset AUM - the company's own claim, with no source or ranking body cited, and 'cumulative' AUM is a gross lifetime figure rather than a current balance. The listed assets run across rental housing (the Episode brand), offices, a Jeju hotel and logistics centres. The relevance to KAIT is scale in the adjacent business: the subject runs a REITs AMC and a PFV AMC as ancillary lines to its trust licence, and the competing platforms here are vertically integrated - development, asset management and property management under one owner - rather than fee-for-service.
[ 디앤디인베스트먼트㈜ ] 디앤디인베스트먼트㈜는 부동산투자회사법상 자산관리회사(REIT's AMC)로서 1.6조원의 주 거시설 자산을 포함한 누적 AUM(Asset Under Management) 5조원의 성과를달성하였으며, 국내 주거시설 자산 운용규모 1위의 실적을 보유하고 있습니다. 상품기획, 인허가관리, 설계 /시공관리, 운영관리, 매각전략 수립 등 One Stop 개발관리ㆍ자산운용 체계를 갖추고 있으 며, 다양한 투자 파트너십으로부터 최적의 투자구조를 수립하여 운용자산의 통합적인 프로 젝트 관리 및 자산운용을 수행할 수 있는 VerticalPlatform을 보유하고 있습니다. […] 2018년 12월 Episode 수유 838을 시작으로 Episode 신촌 369, Episode 서초 393, Episode 강남 262 등 임대주택 자산을 비롯하여 세미콜론 수송, 세미콜론 문래, 세미콜론 명 동, 서울역 오피스, 여의도 태영빌딩 등의 업무시설과 제주조선호텔, 백암물류센터, 남청라 물류센터, 방배동 시니어 등에 이르기까지 다양한 운용자산을 보유하며 안정적 투자 포트폴 리오를 구축하고 있습니다.
p. 28 · Read in context →
SK D&D's sizing of the Korean rental-housing market, from its FY2025 사업보고서 (p.45). Monthly-rent (월세) contracts passed 60% of Seoul lease transactions in 2024 and reached 65.9% by September 2025 as the 전세 deposit system unwinds; single-person households rose from 30.2% of the total in 2019 to 36.1% in 2024, with one- and two-person households projected at 72.4% by 2040. SK D&D's argument is that the private rental market, historically owned and run by individual landlords, is converting to an institutional 기업형 임대주택 model, and it points to Japan - where individuals own about 85% of rental housing but corporate operators run about 80% of it - as the template. The projections are government statistics as cited by SK D&D; the Japan analogy is its own framing. This is the market the subject lists among its expansion areas alongside urban redevelopment and REITs, described here by a company that has already built more than 6,000 units of operating stock in it.
주거용 부동산은 2023년 12월 국내 부동산 거래현황(도심 건축물 기준)에서 73%를 차지하며 , 이는 상업용 부동산의 약 6.1배에 육박합니다. 공급측면에서 주택사업은 분양과 임대의 두 가지 형태로 나뉘며, 임대주택은 전세와 월세로 구분할 수 있습니다. 전세 제도는 세계적으 로 유일한 국내 특유의 계약 구조로, 최근 몇 년간 시장 환경 변화로 인해 월세 전환이 가속 화되고 있습니다. 서울 전월세 거래에서 월세가 차지하는 비중은 2024년 60%를 넘어선 이 후 2025년 9월 기준 65.9%를 기록하며 지속적으로 증가하는 추세를 보이고 있습니다. 또한, 국가데이터처에 따르면 1인 가구의 비중은 2019년 30.2%에서 2024년 36.1%로 꾸준히 증가 하며, 소형 임대주택 수요를 견인하고 있습니다. […] ② 성장성 국내 임대주택 사업은 공공영역과 민간영역으로 구분됩니다. 민간 임대시장은 그동안 대부 분 개인 임대사업자 중심으로 운영되어 왔으나, 안정적 공급 및 전문적인 운영 필요성이 증 가함에 따라 기업형 임대주택 시장으로의 전환이 점점 가속화되고 있습니다. 최근 글로벌 IB및 주요 외국계 기업의 국내 임대주택 시장 진출이 활발해지면서, 기업형 임대주택 사업의 성장 가능성이 더욱 확대되고 있습니다. 실제로, 부동산 패러다임이 유사한 일본에서는 전체 임대주택 중 약 85%를 개인이 소유하고 있지만, 이 중 80% 가량을 기업형 임대주택사업자 가 운영하고 있으며, 국내에서도 이와 유사한 변화가 생길 것으로 예상됩니다.
p. 45 · Read in context →
More peer documents
한국토지신탁 (KOREIT) - FY2024 사업보고서 — FY2024 · 302 pages · p.30 is the same fourteen-company table one year earlier, which makes the year-on-year moves visible - 신한자산신탁 at negative KRW308.6bn, 교보자산신탁 at negative KRW240.9bn, 무궁화신탁 at negative KRW119.8bn and KB부동산신탁 at negative KRW113.3bn net income in 2024, the losses behind the industry's aggregate operating deficit, with 한국자산신탁 one of eight of the fourteen still in profit that year at KRW16.5bn; pp.29-30 also carry KOREIT's own framing of what the trust market is. · Open →
LF Corp - FY2024 사업보고서 (코람코자산신탁 sections) — FY2024 · 363 pages · p.55 extends Koramco's revenue-by-line table back to 2022, when REIT asset-management fees were about KRW110bn - which shows the KRW119.2bn 2024 figure was not a one-off spike and makes the drop to KRW58.2bn in 2025 a genuine break rather than mean reversion. · Open →
SK디앤디 (SK D&D) - FY2024 사업보고서 — FY2024 · 555 pages · p.30 puts SK D&D's operating rental-housing stock at about 4,014 units at end-2024, against more than 6,000 a year later - the growth rate of the institutional rental platform the subject says it wants to expand into. · Open →
Hana Financial Group - Q3 2025 earnings call transcript — Q3 FY2025 · 13 pages · p.8 has Hana Bank's CFO on the composition of IB fee income: real estate is taking a smaller share of loan-arrangement fees while acquisition finance fills the gap - a lender's read on shrinking development-finance volume, which is the origination pool for new development trusts. · Open →
Hana Financial Group - FY2025 earnings call transcript — FY2025 · 18 pages · pp.15-16 continue past the exhibit with the Group CFO on non-banking capital allocation - KRW14.5tn of invested capital contributing only about 12% of group net income, and a decision to stop injecting capital beyond regulatory minimums - the funding backdrop for a top-three trust competitor. · Open →